In celebration of World CLT Day on May 16, the Lincoln Institute of Land Policy in collaboration with the International Center for Community Land Trusts is rolling out a set of resources related to community land trusts (CLTs)—nonprofit organizations that ensure long-term affordability and security for homeowners. These tools, which include publications, case studies, and webinars, are designed to provide municipal leaders and practitioners with insights on effective CLT partnerships and evidence-based recommendations for making homeownership more affordable and accessible.
“CLTs have proven to be an effective tool in addressing the global issue of housing affordability, and we’re eager to make some of the learnings from successful CLTs accessible to policymakers who are interested in scaling up efforts to increase affordable housing stock,” said George W. McCarthy, president and CEO of the Lincoln Institute.
Following the late 2024 release of Preserving Affordable Homeownership: Municipal Partnerships with Community Land Trusts, a Policy Focus Report written by John Emmeus Davis and Kristin King-Ries, the Lincoln Institute has released a four-page distillation of the full report. Both publications offer information on current policy collaborations among community land trusts, cities, counties, and states, and recommendations for working together productively. A Spanish-language version of the full report will be available in the fall.
This collection of international essays offers global perspectives on the challenges and opportunities CLTs face. With contributions from Australia, Brazil, Canada, Europe, France, and the United Kingdom, this new publication reflects on the Preserving Affordable Homeownership Policy Focus Report’s findings and how the evolving role of CLTs differs across the world.
This multimedia case study features a 22-minute video and other resources examining an innovative effort to produce affordable housing and combat gentrification and displacement in Vermont’s largest city. The case highlights replicable strategies that made the project a success.
The Lincoln Institute will partner with the International Center for CLTs to host a free webinar for the public and policymakers on June 24. Moderated by John Emmeus Davis, coauthor of the Preserving Affordable Homeownership Policy Focus Report and Policy Brief and board member of the International Center for CLTs, the discussion will feature Ruthzee Louijeune, president of the Boston City Council; Evelyn Dobson, CEO and founder of the Delray Beach, Florida, CLT; Erika Malone, homeownership division manager for the City of Seattle; and Enrique Silva, chief program officer of the Lincoln Institute. Together, these panelists will explore how cities are advancing affordable homeownership and will highlight practical steps for successful municipal-CLT partnerships.
Lead image: Mayor Kim Janey joins the Chinatown Community Land Trust to welcome first time low income homebuyers that purchased the CLT first permanent affordable condo units with a 99 year community land trust lease. Credit: Mayor’s Office Photo by Isabel Leon
Webinar and Event Recordings
How Disaster Policies Lead to Manufactured Housing Policy Disasters
June 3, 2025 | 3:00 p.m. - 4:00 p.m. (EDT, UTC-4)
Offered in English
Speakers: Dani Slabaugh, University of Colorado Denver, and Rachel Siegel, The Pew Charitable Trust
SHARE
Watch the Recording
Mobile and manufactured housing communities (MHCs) are often some of the hardest hit by flooding disasters, and the disaster vulnerability of this housing type stems from a confluence of titling, financing, and flood mitigation policies. These policies have centered single-family real property homes while explicitly excluding MHC homeowners—over time pushing these communities into floodplains and barring them from mitigation or recovery mechanisms.
This webinar will utilize recent geospatial data from a 12-county sample in Colorado to shed light on the policies that create disproportionate flood exposure and exacerbate barriers to flood recovery, basic home maintenance, and weatherization in MHCs. The webinar will conclude with a discussion about potential policy interventions at the state, local, and federal level.
Speakers
Dani Slabaugh, PhD MLA (they/them), is a community-based researcher based at the University of Colorado Denver utilizing qualitative, quantitative, and geospatial methods to further climate and environmental justice goals in planning and public policy. Their background in mutual aid disaster recovery after multiple hurricane and flood events led them to pursue a PhD focused on climate justice research in collaboration with mobile home park resident activists and community leaders in Colorado. Their work centers impacted communities’ visions of a just and thriving climate future through transformative change.
Rachel Siegel is a senior officer with The Pew Charitable Trust’s housing policy initiative, conducting original research and analysis on the availability, safety, and affordability of mortgages and on alternative financial arrangements for purchasing manufactured homes and other low-cost forms of housing. She has also worked on Pew’s consumer banking and finance teams focusing on overdraft, prepaid cards, and mobile payments. Siegel holds a bachelor’s degree in economics from the University of Vermont and a master’s in economics from Boston University.
Details
Date
June 3, 2025
Time
3:00 p.m. - 4:00 p.m. (EDT, UTC-4)
Registration Deadline
June 3, 2025 3:59 PM
Language
English
Keywords
Environment, Land Use, Urban Design
Webinar and Event Recordings
Municipal-CLT Partnerships that Produce and Preserve Affordable Homeownership
Moderator: John Emmeus Davis, Board Member, International Center for CLTs
Speakers: Enrique Silva, Ruthzee Louijeune, President, Boston City Council , Evelyn Dobson, CEO and Founder, Delray Beach Community Land Trust, and Erika Malone, Homeownership Division Manager, City of Seattle
SHARE
Watch the Recording
City and county governments are always looking for ways to make their investments in affordable housing do more and last longer. That is why a growing number of them are partnering with community land trusts (CLTs). These nonprofit organizations ensure that lands, monies, and regulatory measures used by municipalities to bring homes within the reach of people of modest means will remain affordable for many years, across multiple resales. A recent Policy Focus Report from the Lincoln Institute, Preserving Affordable Homeownership, documents the rise of these municipal-CLT partnerships. In this webinar, municipal leaders and CLT practitioners will discuss the report’s principal findings and describe how their own cities are supporting the production and stewardship of CLT homes with lasting affordability.
Moderator
John Emmeus Davis
Partner, Burlington Associates in Community Development LLC
John Emmeus Davis is a city planner who has spent much of his 40-year career providing
technical assistance to CLTs and documenting their history and performance. He coauthored the Lincoln Institute’s 2008 publication The City-CLT Partnership. He previously served as housing director in Burlington, Vermont, and was dean of the National CLT Academy. He is a partner at Burlington Associates in Community Development LLC, a national consulting cooperative. He is a founding board member of the International Center for CLTs and editor in chief of the center’s imprint, Terra Nostra Press.
Panelists
Evelyn Dobson
CEO and Founder, Delray Beach Community Land Trust
Evelyn S. Dobson is the CEO and founder of the Delray Beach Community Land Trust (DBCLT). Her involvement with the organization began during her tenure as a commissioner for the Delray Beach Community Redevelopment Agency. She officially joined DBCLT in January 2007 as operations manager, was appointed interim executive director in November 2008, promoted to executive director in March 2009, and has served as CEO since 2018.
In her role, Evelyn oversees all aspects of program development, policy implementation, and asset management—currently valued at $7.9 million. She works closely with housing partners and affiliates to further the organization’s mission and ensure long-term community impact. With multiple industry certifications, she leads innovative, high-quality programs that respond to evolving housing trends and community needs.
With over 18 years of experience in private property management and development, and eight years in banking, she brings a depth of knowledge and strategic insight to her work that continues to strengthen DBCLT’s mission and legacy.
Ruthzee Louijeune
President, Boston City Council
Ruthzee Louijeune, serving her second term as city councilor at-large and unanimously elected as Boston City Council president, is a grounded, thoughtful, and inclusive leader. A dedicated public servant, Ruthzee is committed to fostering shared prosperity in Boston with a focus on justice and equity. Born and raised in Mattapan and Hyde Park to working-class Haitian immigrants, Ruthzee’s journey is deeply rooted in the fabric of Boston. As a lawyer, Ruthzee fought for families facing eviction and foreclosure in Boston Housing Court. She defended voting rights in cases before the US Supreme Court, helped elect progressive prosecutors nationwide, and served as the senior attorney on Senator Elizabeth Warren’s presidential campaign. A fierce housing advocate, she drafted agreements that secured millions of dollars for first-generation homeowners as a member of Massachusetts Affordable Housing Alliance (MAHA).
Additionally, she served as vice chairs of the Committee on Government Operations and Housing and Community Development. In these roles, she advocated for affordable housing and accessible homeownership, resilient, energy-efficient school buildings, teacher diversity, and more supportive services for students—all in an effort to address racial justice and equity. Ruthzee is the first Haitian American elected to municipal government in Boston, the US city with the second-largest Haitian population per capita, and she is the first Haitian American to serve as president of the council. Her multifaceted background and unwavering dedication to serving her community make her a transformative leader shaping the future of Boston.
Erika Malone
Homeownership Division Manager, City of Seattle
With over 25 years of experience in community development, Erika Malone has dedicated her career to advancing sustainable affordable homeownership solutions. As the homeownership division manager at the City of Seattle Office of Housing, she crafts and implements funding policies to support the development of equitable, sustainable, and affordable homeownership opportunities. Her past roles include director of technical assistance for the National Community Land Trust Network (now Grounded Solutions Network), executive director of the Northwest Community Land Trust Coalition, and programs director for Kulshan Community Land Trust in Bellingham, Washington. She is recognized as a national expert and a technical resource for community land trusts across the country.
For a concept so central to the composition of neighborhoods everywhere, density is little understood. Compact residential multifamily and mixed-use development is regularly perceived in negative terms, particularly when new construction is proposed at infill sites in established neighborhoods. A slew of upzoning measures and bans on single-family-only zoning have intensified scrutiny of the concept of greater density. Designed well and located near transit, parks, and other amenities, however, density can be pleasant, elegant, and functional, evocative of traditional neighborhood design from the early twentieth century.
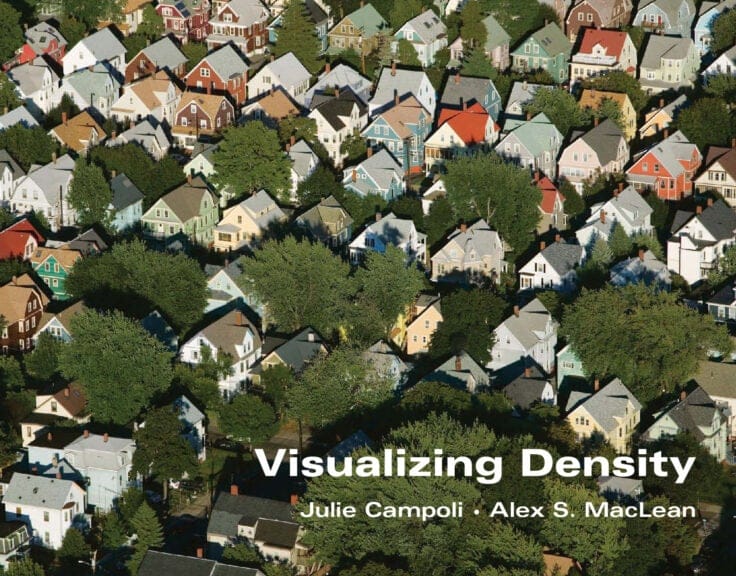
This Visualizing Density subcenter is a guide to density in all its forms. It encourages planners, policymakers, practitioners, journalists, and citizens to explore how different densities fit into the context of cities and towns around the world. The Lincoln Institute’s work on density informed Visualizing Density—one of our most popular titles—by Julie Campoli and Alex MacLean, an aerial photographer. An ensuing volume, Made for Walking, also by Julie Campoli, showcases well-functioning urban agglomerations of density and mixed-use development.
This best-selling and richly illustrated book by landscape architect Julie Campoli and aerial photographer Alex S. MacLean helps planners, designers, public officials, and citizens better understand how residential density can help save energy, dollars, and the environment.
Book
City and Regional Planning, Land Use and Zoning, Technology and Tools, Urbanization
Through hundreds of photographs and maps, this book showcases 12 vibrant North American neighborhoods where residents can live comfortably without a car, and identifies the replicable policies and amenities that foster walkability.
Book
City and Regional Planning, Housing, Land Markets, Urbanization
The Lincoln Institute provides a variety of early- and mid-career fellowship opportunities for researchers. In this series, we follow up with our fellows to learn more about their work.
With a master’s degree in urban planning and a PhD in anthropology, Adriana Hurtado Tarazona has long been fascinated by the intersection of human behavior and urban form—especially how and where people choose to live. After receiving a graduate student fellowship from the Lincoln Institute’s program on Latin America and the Caribbean (LAC), she spent years studying social housing megaprojects on the outskirts of Colombia’s cities, speaking at length with the people who lived in them to learn how they experienced their community and built environment.
Today, Hurtado Tarazona is an associate professor of planning, governance, and territorial development at the Interdisciplinary Center for Development Studies (CIDER) at Universidad de los Andes in Bogotá, Colombia. “I teach an introductory course on land planning instruments, so I’m still talking about what the Lincoln Institute taught me back in 2005, when I went to a course in Quito,” she says.
In this conversation, which has been edited for length and clarity, Hurtado Tarazona discusses why housing ought to be a social policy versus an economic one, shares some of the surprising sentiments she’s heard from residents of social housing, and explains why paying people to upgrade existing homes may be a better solution than subsidizing new homebuyers.
JON GOREY: What is the general focus of your research, and how did your Lincoln Institute fellowship support that work?
ADRIANA HURTADO TARAZONA: I received the fellowship for my master’s thesis in 2006. I was doing an analysis of the impact on land values of some of the BRT infrastructure in Bogotá —the TransMilenio. It was one of the first studies; at the time, the TransMilenio had only four years of implementation, so it was very new. I was trying to document the changes in the urban space around the two big stations, from the perspective of the land market and from the perspective of the residents of the area.
It was very nice to be in that program, because I got to meet a lot of the professors linked with the Latin America program. I loved the experience. And three years ago, one of my students got the same fellowship that I got almost 20 years before. So it was really nice to now be in a different position, sponsoring my student, and she got to live the benefits of that fellowship.
JG: What are you working on now, and what are you hoping to work on next?
AHT: Right now I have four research projects—two of them are related to the main topic of my PhD thesis, which is social housing, specifically the production and urban expansion of social housing megaprojects in urban borders. One project, which we are finishing this year, is called vertical peripheries, with York University in Toronto. We analyze the subjective impact of living in the periphery, but also the impacts on urban planning and governance of this metropolitanization process, where the social housing overflows the urban limits of Colombian cities. The other one is focused on the economic impact of access to social housing. So we are going to analyze specifically how women-led households have to change their domestic economies to keep up with the costs of accessing homeownership for the first time.
The third one is the care infrastructure project, led by the University of Washington in Seattle. It’s a comparative project between Belfast, Belo Horizonte in Brazil, and Bogotá. We are trying to analyze stories of urban change in general, and specifically, in Bogotá, we are analyzing how care became a focus of urban policy, which was not the case until very recently, and we are analyzing the birth of the district CARE system as urban infrastructure. We have these new regulations that understand care infrastructure at the same status as water, sewage, and roads, which is very interesting, and we are trying to document how that could happen, under what conditions did that happen?
And another thing I’m doing with the Lincoln Institute is a small research grant from last year. The main researcher is from Brazil, and along with Argentina, Bolivia, Peru, and Colombia, we’re trying to do a comparative analysis of interventions that try to support densification.
The Manitas Care Block in Bogotá opened in 2020, the first of more than 20 facilities in the city designed to provide services for caregivers. Credit: LLANOFOTOGRAFIA (www.llanofotografia.com).
JG: What’s something surprising or unexpected you’ve learned in your research?
AHT: I have been asking people if they’re happy with their homes, in general, and the first surprise was from an urbanistic perspective. Local urbanists are very critical of these peripheral, massive, standardized, social housing megaprojects, because they are far away from the city, disconnected, with problems of accessibility. I knew all that, and I came to the fieldwork with this very critical perspective.
But then I sat with people, and the first thing they told me was, ‘No, I love this. I love the order. I love that everything is standard.’ Everything that urbanists see as the ‘unlivable city’ and the ‘nonplace,’ the people were saying, ‘No, I like this because it’s planned, it’s orderly, it’s clean.’ That was the first thing that surprised me.
And it surprised me more because they had lived before in self-constructed houses where they had more space, more flexibility of spaces, and they were better located in the city. But then when I spent time with them, I started realizing that this is part of the trade-off people make, because the housing market didn’t allow them to buy anywhere else, and they prioritized homeownership in the formal city over the time they had to spend in transport, over being close to family, to friends, to networks of support.
They knew what they were losing, but this was part of a very conscious trade-off: I am losing this, but I’m gaining this. And the thing they were gaining was the stability of their own home, even if it was small, far away, and very expensive. And that has a lot to do with the opportunities that this country gives to people for social mobility, which are narrowly focused on having access to property. Being part of the new middle class in Colombia means primarily having your own home in the formal city, not in the informal neighborhoods.
JG:When it comes to your work, what keeps you up at night? And what gives you hope?
AHT: What worries me is that housing policy in Colombia—and I think this is the case in other countries also—follows the logic of real estate agents, that the only way to solve the housing problem is to build new housing and sell it to low-income households with subsidies. But we also have lots of alternatives and lots of different ways to address the housing problem.
In Colombian cities, including Bogotá, the qualitative housing deficit is three times more than the quantitative housing deficit. So that means three times more households need better housing and not new housing. But our housing policy gives all the resources and all the attention to building new housing. Neighborhood housing upgrade programs exist, but they don’t have enough budget, they don’t have enough attention, and they are not seen as the legitimate way to solve the housing problem.
So what I really wish we would do is to change the focus and to start paying enough attention and giving enough resources to upgrading what we already have, the built city. It would be environmentally better, economically better for people. There are a lot of advantages, but of course, it’s a slower process. It doesn’t show lots of big numbers, and it doesn’t follow the interest of these real estate and financial sector agents.
What gives me hope is that we have some interventions that are showing good results. One of them is the support for densification in informal-origin neighborhoods. These are programs that recognize that there are neighborhoods of informal origin, with self-constructed homes, that are older, they have good locations in the city, they already have access to the urban goods and services and infrastructure, but they need support to grow in height.
So we have a program here that offers help in structural reinforcement, and they offer subsidies for people to build a second floor on their houses, and then that new unit they could use to live in, if they are crowded, or they could rent it to other households, so they have a new source of income. I think it’s a really innovative program, because at the same time, it ameliorates housing availability and the structural security of the houses, and also gives low-income households the opportunity to have new income from these new units.
The state is supporting a thing that will happen anyway, with or without their help. But if the state intervenes, it happens better, it happens more securely, and it’s a different way to invest public resources to solve the housing problem. But these are small pilot projects. So the thing I want to work on in the future is to figure out how to scale this up and make housing and neighborhood upgrading a more central part of urban policy.
JG:Can you talk about the connection between anthropology and urban planning?
AHT: In all my research projects, I try to understand urban processes from above and from the ground, and I think the combination of having studied anthropology and urban planning allows me to do that. It’s a very good way to understand one process from different perspectives. And specifically for technical topics, such as land management instruments or land value capture, when you talk to people that are living the process, you can amplify your understanding.
Since my master’s thesis, I’ve been curious about how people understand land value. In the contexts I studied, people are very preoccupied about the changes in land value of their properties, but they deal with those changes, or prospective changes, in very different ways.
For example, my student’s thesis was analyzing ethnographically how people deal with the uncertainty of the delays of an urban renewal plan, how they understand the prospective land value increment of their home, and how that aspiration of profit implies tensions in daily life with other values of their home, like the use value of their home.
And I have found the same thing in social housing, this constant tension between the home as a place for living and the home as an investment, from which they are interested in profiting. Even if they are very low-income households, those two narratives and values of home are always in tension, and they impact not only their individual behaviors, but also their community behaviors, and even their ways of relating to public institutions and the city.
So that’s my main curiosity, and that’s why I combine talking to people, being with people, and just spending time with them, with more technical things like analyzing documents, laws, regulations, and quantitative data, too.
JG: What’s one thing you wish more people understood about social housing?
AHT: We need to recenter housing policy as a social policy and not as an economic policy. We have the opportunity in Colombia, and other Latin American countries that have not yet fallen into hyper-financialization, to not follow the trajectory of the United States, of Spain, of places in which the housing crisis is worse now than ever; we are not yet in that state.
JG:What’s the best book you’ve read lately, or a favorite TV show you’ve been streaming?
AHT: I really enjoyed reading Melissa García-Lamarca’s book about people in debt in Barcelona, Non-Performing Loans, Non-Performing People. It’s about the subjective impacts that living in debt has on people, and how we understand debt as not only an economic issue, but also as a moral issue.
I’m trying to link that with our new project. I’m starting to read feminist economic analysis and anthropological economic analysis, to have a very deep understanding about what living in debt, and housing debt specifically, means for people, and what impact does this have on different aspects of their daily lives. Because here, debt is not only restricted to mortgages—low-income people here have to resort to all kinds of formal and informal debt to pay their living costs. So it’s debt with a relative, debt with a bank, the mortgage, and then it also links even to criminal debt, a criminal lender, people that charge illegally high interest rates to low-income households.
I try to watch TV on really unrelated topics. I was watching Silo, which is a dystopian futurist series about people that live in a high rise, but it’s subterranean—which is really depressing! But I like these post-apocalyptic things.
Jon Gorey is a staff writer at the Lincoln Institute of Land Policy.
Lead image: Adriana Hurtado Tarazona of Universidad de los Andes in Bogotá, Colombia. Credit: Courtesy photo.
Events
Innovations in Manufactured Homes (I’m HOME) Annual Conference 2025
September 10, 2025 - September 11, 2025
Offered in English
SHARE
The 2025 Innovations in Manufactured Homes (I’m HOME) Annual Conference will bring together leading voices from across the manufactured housing sector—from homeowners and community organizers to policymakers, developers, researchers, and investors. This year’s event in Atlanta, Georgia, offers a timely platform to explore the full spectrum of challenges and opportunities in manufactured housing, with sessions covering zoning reform, financing innovation, disaster resilience, federal infrastructure investment, tenant protections, energy efficiency, and more. Featured programming will include case studies, research briefings, community spotlights, and policy panels—all focused on keeping manufactured housing safe, affordable, and sustainable for generations to come.
In addition to thought-provoking sessions, attendees have an opportunity to connect and collaborate through live manufactured housing construction demonstrations, networking lounges, and an unforgettable southern BBQ in collaboration with SECO 25. Whether you’re advancing housing justice, scaling your portfolio, or crafting local policy, this conference offers practical insights, cross-sector conversations, and a shared commitment to strengthening affordable homeownership. Participants will leave with new tools, connections, and inspiration to drive impact in their communities.
The deadline to register for the I’m HOME Conference is September 3, 2025.
Providence, Rhode Island is a unique story—a “second city” in the orbit of significantly larger Boston to the north, but punching above its weight as a desirable place to live and work. With a population of nearly 200,000 people, it’s the third largest city in New England after Boston and Worcester, Massachusetts, and was once home to extensive manufacturing and mills—a classic smaller legacy city, making its way in a postindustrial world.
Key city-building strategies have driven revitalization over the last 30-plus years. Providence became known for embracing New Urbanism, historic preservation, and adaptive reuse in its traditional downtown, and for culinary, cultural, and arts innovations like WaterFire, a festival of lanterns along three downtown rivers. The Congress for the New Urbanism is returning to Providence in June of this year for its annual summit.
At this juncture in the remarkable narrative, after dismantling highways and daylighting rivers and paying attention to urban design, the Renaissance City is now grappling with concerns about affordability, failing schools, crumbling infrastructure, and lingering pockets of post-manufacturing blight
All of that is the scenario for Brett P. Smiley—once chief of staff for former Rhode Island Governor Gina Raimondo—who was elected the 39th mayor of Providence in 2022. In this latest episode of the Land Matters podcast, and as part of the continuing series Mayor’s Desk—interviews with local leaders tackling global problems—Smiley talks about the challenges of keeping up the city’s revitalization momentum while addressing stubborn disparities.
“We’ve come a long way, and while there’s many of these kinds of postindustrial cities that continue to struggle, Providence is on an entirely different trajectory,” Smiley says. “Through the pandemic, a lot of people moved to Providence—primarily from the major population centers of New York and Boston, but from really around the country—where you saw people still wanting urban amenities, still wanting arts and culture and diversity, walkability, but with a little bit less work than it is to live in Manhattan or Brooklyn, certainly less expensive than living in those places or in Boston.”
While welcoming the influx, he says, “We’ve not kept pace with building, and as a result, housing prices are skyrocketing. That was in fact one of our competitive points in that we were less expensive. In the decade ahead, we’ve got a lot of work to do to bring down the cost of housing. What we have is a supply shortage and the solution to that is to build more.”
Also in the interview, Smiley reflects on his contrarian views on bike lanes, how to better support night-shift workers with improved transit and other services, housing as an economic development strategy to attract and retain major employers, and his experiences engaging with constituents.
He also shares his thoughts on how to balance public input with policy leadership; he was quoted earlier this year as saying, “There are times when public leaders need to say, ‘Pencils down, we’ve heard enough. This is what we’re doing.’”
Smiley came into office promising to prioritize public safety, education, affordable housing, and climate resilience, relying on “strategic investments and data-driven solutions.” Before being elected mayor, he was head of the Rhode Island Department of Administration and chief operating officer of Providence. Smiley graduated from DePaul University with a degree in finance and an MBA. He resides on the East Side with his husband, Jim DeRentis, their dog, and their two cats.