Cities around the world seem to be stretching out physically and consuming land at a rate that exceeds population growth. As populations double, land use triples.
When city growth comes up in public discourse, the conversation almost invariably focuses on population. We speak of “booming” cities that have grown from, say, 2 to 5 million in just a few decades or declining cities that are hollowing out and losing residents at a rapid rate.
The common unit of understanding and measurement, in other words, is almost always the number of people. Measures of land use are often missing from the picture, despite the fact that cities grew much more in land use than in population between 1990 and 2015, according to data from the UN-Habitat Global Urban Observatory. In developed countries, urban population grew 12 percent, while urban land use increased by 80 percent. And in developing countries, population expanded by 100 percent while urban land use rose 350 percent.
Land use issues will become more critical as the world population exceeds 9 billion and 2.5 billion persons migrate to cities by 2050, according to the United Nations’ projections. Configuring urban areas and their available resources to support this massive inflow will be critical to sustaining human life on the planet, says George W. “Mac” McCarthy, president and CEO of the Lincoln Institute.
It’s a profound area of concern: How exactly are these rising urban populations changing global maps? Further, can we observe regular, even predictable, patterns? And are these trend lines, such as they are, sustainable over time?
To date, there has been little scientific understanding of broad global patterns related to how city borders, systems, and land-use patterns are changing. But the newly revised, second edition of the online Atlas of Urban Expansion, first published in 2012, aims to fill this crucial gap in knowledge. Produced through a partnership among UN-Habitat, the New York University Urban Expansion Program, and the Lincoln Institute, the new Atlas performs very precise analysis of satellite imagery, coupled with population figures and other data, to study the changing nature of cities observed from 1990 to the present. The full report and data are set to be unveiled this October at the Habitat III global cities summit in Quito, Ecuador, as part of the implementation of the UN’s New Urban Agenda.
The new Atlas analyzes 200 cities (up from 120 in the 2012 sample), rigorously selected from among the 4,231 cities in the world with populations greater than 100,000 (as of 2010) that constitute a representative sample of large urban areas. The 200 cities in question make up about 70 percent of the world’s urban population.
The United Nations statistics division has now accepted and adopted this “UN Sample of Cities” as a way to conduct ongoing analysis of urbanization trends. “Cities, how they form, and the effects of urbanization on the quality of human life must now be treated as a science,” says Joan Clos, executive director of UN-Habitat, during the launch at UN headquarters in New York in June 2016: “The unprecedented confluence of climate change, population boom, and the rush to live in cities means that our critical human development will take place in cities.”
With unplanned settlement fluidly redefining many urban boundaries, it is crucial, experts and planners say, to produce a consistent method for studying cities as contiguous spatial units, not just administrative jurisdictions. The UN Sample of Cities also enables transition from an urban agenda based on country-level data to one predicated on city-based data collection and analysis.
Studying such a sample allows us to infer some generalizable rules about large urban areas, notes Atlas coauthor Shlomo “Solly” Angel, a professor and senior research scholar at New York University. “The sample accurately represents that universe,” he says of cities with populations of 100,000 persons or more, “so you can actually make statements about that universe given information about the sample. That’s the more scientific contribution of this Atlas.”
Land Consumption and “De-densification”
What, then, can be said of the world’s large cities, now that such representative data have finally been collected and crunched?
One reliably observed pattern is that cities around the world seem to be stretching out physically and consuming land at a rate that exceeds population growth. This tendency corroborates the findings of the first-edition Atlas, which indicates “falling density.” In the past, this was termed “sprawl,” and some refer to it now as “de-densification.” In any case, for a planet increasingly concerned with sustainability, energy efficiency, climate change, and resource scarcity, this is not a good trend: Density generally allows for greener and more sustainable living patterns.
Angel notes that there is a kind of rough statistical rule that emerges from the new Atlas work: As populations double, land use triples. “Even though people would like to see densification increase or at least stay the same, it doesn’t,” he adds.
Many policy makers have been unable, or unwilling, to see this reality unfolding in recent decades. Don Chen, director of Equitable Development at The Ford Foundation, says that the issue of sustainable growth is “very uneven in terms of planning officials’ awareness.” In many countries, he adds, “various orthodoxies are battling it out,” and frequently the “cards are stacked against us” in terms of changing norms and official attitudes: “For many, many decades, and in some countries for centuries, there have been incentives [for] building on virgin land.”
And even where there is political will for change, there are “multiple dimensions of capability to build upward, such as in-ground infrastructure,” Chen notes. Wider complex systems must be coordinated from a policy perspective in order to achieve greater density and land conservation.
In any case, the data analysis effort undertaken in the Atlas—which at root is intended to help define a new “science of cities”—may serve as a wake-up call. Angel says the Atlas can be a “tool for convincing policy makers that the expansion they must prepare for is considerably larger than their own little back-of-the-envelope calculations, or what their planners have in their master plans.”
Increasing density again will necessitate sacrifice and modification of existing norms for living standards in many places: It will require people to live in smaller apartments and homes, in multifamily housing, and in higher buildings. It also will frequently require redevelopment of low-density areas in cities.
McCarthy acknowledges that the data are “a little bit chilling,” as they reveal a pervasive pattern that signals huge trouble ahead. “It’s something that we have to stop—whether we call it ‘sprawl’ or ‘de-densification’ or something else,” he says. “We can’t continue to consume all of our best land with urban development. We still have to feed ourselves. We still need to collect water.”
He also notes many ill-fated attempts to build large housing units far outside denser urban areas, leaving millions of units across the world largely empty. This has happened in many countries, from Mexico and Brazil to South Africa and China. “Why is it that we continue to build these developments in the middle of nowhere and expect people to live there?” McCarthy says, noting that it is vital to link jobs and industrial activity with housing.
Clearly, smarter, more proactive planning is required for growth across the world, the project’s researchers say. That means finding the right ways to channel city growth spatially and to create the infrastructure—transportation, water, sewer, and other necessities—so the new settlements and housing units are serviced appropriately.
Moreover, it is also necessary, Atlas researchers say, for many of the big cities around the world—from Lagos, Nigeria, to Mexico City to Zhengzhou, China—to adopt more next-generation thinking about so-called “polycentric” cities. That will require moving beyond the traditional paradigm of hulking, monocentric cities with a huge urban core and instead creating polycentric networked hubs, whereby a metropolitan area will have many interlinked urban centers.
Signatures of Unplanned Settlement
The satellite imagery analyzed in the Atlas also highlights other key patterns that are both drivers and/or symbols of the overall de-densification trend worldwide.
One very granular mark is the lack of four-way intersections, a clear sign that roads are being laid out haphazardly, in a largely unplanned way. Such informality and unplanned development have been increasing over time across the world. The pattern, however, is strongly correlated with lower GDP per capita, and therefore is more pronounced in the developing world and global South. Linked to this observed pattern is an increase in urban block size, as shantytowns and unplanned settlements of many kinds grow without regard to transportation needs.
Indeed, the Atlas also suggests a pervasive lack of orderly connections to arterial roads, which are key to facilitating transportation to employment and economic networks. Built-up areas within walking distance of wide arterial roads are less frequent than they were in the 1990s, according to data from that decade. And more generally, there is simply not enough land being allocated for roads.
In addition, low-density tracts and small dwellings are unnecessarily consuming precious urban open space—parks and green spaces that can make dense urban areas more livable.
Angel says planners need to get ahead of the coming wave of urban migration and secure land for transportation, affordable housing, arterial roads, and open space. That needs to be done before settlement happens, when land prices subsequently soar and the logistics of moving populations become trickier. “This can be done at a relatively small cost,” Angel notes. He suggests that planners begin to “make some minimal preparations for it.”
Even in countries where there is a high degree of central planning, the data contained in the Atlas may prove helpful for diverse land management challenges.
“Compared to most cities in the developing world, Chinese cities are better managed,” says Zhi Liu, director of the Lincoln Institute’s China program. “The Atlas is still useful for China, as it provides accurate, visual urban expansion data and analytics to planners that could strengthen their understanding of the scale and patterns of urban expansion in their cities.”
The Atlas Data Challenge
Behind the new analytical insights produced by the Atlas, an intriguing and important backstory of data collection and analysis highlights future challenges for urban theory and monitoring of global cities, especially in developing nations.
Alejandro “Alex” Blei, a research scholar in the urban expansion program of New York University’s Marron Institute for Urban Management, said that assembling the 200 cities for the representative sample was no easy task, as there is no universally accepted definition for a metropolitan area. Researchers had to account for variables such as regional location, growth rate, and population size in order to ensure the sample was representative, and they had to create a careful and defensible methodology.
NASA’s Landsat database, a satellite imagery program running since the 1970s, was the basis for the spatial analysis. While that methodical, scientific dataset is of exceedingly high quality, the underlying population data, which was key for establishing migration- and settlement-related patterns, was frequently less than perfect.
“Some countries have very well-established data programs,” Blei said. But in other cases the data are very “coarse,” and large cities, particularly in the developing world, have only broad census zones. It is therefore difficult, at times, to make fine-grained insights about population changes in connection with land use shifts, as the researchers had to assume equal density over large tracts of the metropolitan area in question.
Scanning the NASA pictures, the researchers had to analyze pixels to assess whether there was impervious coverage surface or soils. They performed this task with powerful software according to well-established methods, but correlating it with population data was not always smooth. “Unfortunately, there’s not very much we can do if the data are not very good, but we did the best we could under the circumstances,” Blei says.
Evidence suggests the need for less variation in population data collection and synthesis across countries, in order to derive more actionable insights for policy makers in every country. And more global consensus is needed around the definition of cities. The U.S. Census Bureau defines them very precisely as “urbanized areas,” or “metropolitan statistical areas,” but they are frequently defined in more scattered ways by other countries’ data collection agencies. Asia and Africa—home of many of the fastest-growing cities, both in terms of population and geographic extent—suffer from a lack of granular city population data that speak to neighborhood-level change.
Global Nuances and Uncertain Futures
The publication of the new Atlas will, of course, join a long debate in policy and academic circles about how to measure sprawl, both high- and low-density, and the best models for addressing related issues. The new Atlas also speaks to a long research literature on the consumption of resources and quality of life in urban contexts.
Enrique R. Silva, a senior research associate at the Lincoln Institute who has specialized in Latin American planning and governance issues, notes that the Atlas research will continue to help advance understanding of government planning and rule-making, as well as residential pricing. The 2016 Atlas project includes surveys conducted with various stakeholders in cities that might yield insights on planning policies and markets, among other issues.
“It’s definitely an effort that is needed,” Silva says. “It’s a first-mover type of project. The measure of success will be the extent to which other researchers, whether through critique or support of the initial idea, can improve upon it and contribute to our understanding of how cities are growing, or even contracting.”
It will also help ground-level understanding for those studying or making policy in particular cities. Silva points to a place like Buenos Aires, which he calls a “classic case” where the expansion of territory is occurring faster than the population growth—and where many people are being displaced outward from the denser city core. Silva says that research by his Lincoln Institute colleague Cynthia Goytia has shown how lax land use regulation affects settlement patterns. Land markets and their regulations affect affordability, and this can result in unplanned settlements, her research suggests.
Neema Kudva, an associate professor at Cornell University who is an expert in growth patterns in India and South Asia, also praises the “very careful work” performed in the Atlas effort. But she worries that smaller cities—those under 100,000 and therefore excluded from the analysis—may see different dynamics that are subject to more variable patterns and experiences.
In trying to create “one science of cities,” she says, we may miss significant differences between small and big metropolitan areas, limiting our ability to imagine creative interventions. “The difference between small and big can be the ability to influence political processes, the ability to garner funds, to organize, to intervene,” Kudva says. “For a person like me who is interested in smaller places, things like the Atlas provide important suggestions, important points of reference, important counterpoints, but they are not always useful.”
Kudva also wonders if large-scale, emerging changes related to energy systems, global warming, sea-level rise, and political upheaval may alter worldwide land use patterns, compared to those observed in the past. The issue of falling density is potentially reversible, she believes. “That trend could change,” she says. “We need to play a more interventionist role.”
Still, better data and a more detailed picture of settlement patterns can substantially help address challenges common to cities of many different sizes. Chen, of the Ford Foundation, notes that research like the Atlas is necessary to combat issues such as unequal access to opportunity. “We need baseline data, and we need to understand the relationship between how we use land and other things.”
The issue of global inequality, which McCarthy calls the biggest “unassailable challenge” of cities, looms in all of the data. Beyond the layers of the Atlas’s global maps are stubborn facts and dilemmas that researchers and policy makers are only beginning to understand and address. “The biggest one is the absolute concentration of poverty and geographic isolation of large segments of the population,” McCarthy says, noting that sometimes 30 to 50 percent of residents in many large cities live in “deplorable conditions.”
Decent affordable housing that is meaningfully integrated into the economic network and flow of cities has to be a priority. Yet many national efforts to date have failed to achieve that goal. “That’s the thing that I find most vexing,” McCarthy says.
As the new Atlas is rolled out in October at the UN-Habitat III conference in Quito, that issue—and many others affecting the world’s fast-growing cities—is sure to be framed even more precisely and powerfully by the new, comprehensive data.
John Wihbey is an assistant professor of journalism and new media at Northeastern University. His writing and research focus on issues of technology, climate change, and sustainability.
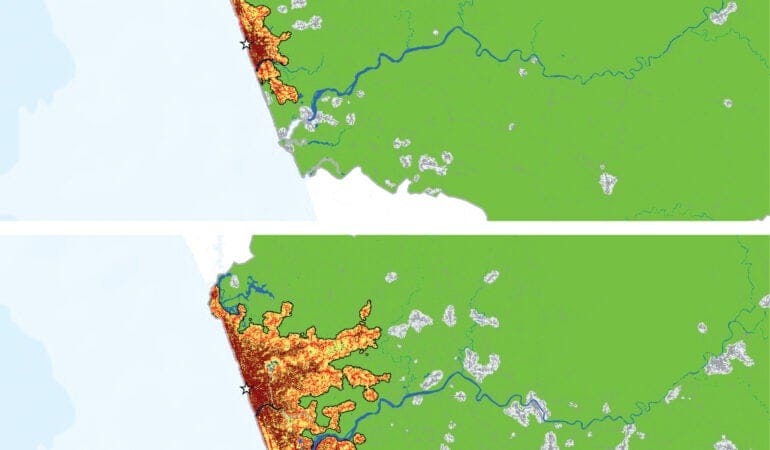
Image by New York University Urban Expansion Program

The Chesapeake Bay is a cultural icon, a national treasure, and a natural resource protected by hundreds of agencies, nonprofit organizations, and institutions. Now with unprecedented accuracy, a new ultra-high-resolution digital mapping technology, developed by the Chesapeake Conservancy and supported by the Lincoln Institute of Land Policy, is pinpointing pollution and other threats to the ecosystem health of the bay and its watershed, which spans 64,000 square miles, 10,000 miles of shoreline, and 150 major rivers and streams. At one-meter-by-one-meter resolution, the “precision conservation” mapping technology is gaining the attention of a wide range of agencies and institutions that see potential applications for a variety of planning purposes, for use throughout the United States and the world. This new land cover dataset, created by the Conservancy’s Conservation Innovation Center (CIC), has 900 times more information than previous datasets, and provides vastly greater detail about the watershed’s natural systems and environmental threats—the most persistent and pressing of which is pollution of the bay’s waters, which impacts everything from the health of people, plants, and wildlife to the fishing industry to tourism and recreation.
“The U.S. government is putting more than $70 million a year into cleaning up the Chesapeake but doesn’t know which interventions are making a difference,” says George W. McCarthy, president and CEO of the Lincoln Institute. “With this technology, we can determine whether interventions can interrupt a surface flow of nutrients that is causing algae blooms in the bay. We can see where the flows enter the Chesapeake. We’ll see what we’re getting for our money, and we can start to redirect the Environmental Protection Agency (EPA), the Department of Agriculture, and multiple agencies that might plan strategically but not talk to each other.”
The nonprofit Chesapeake Conservancy is putting finishing touches on a high-resolution map of the entire watershed for the Chesapeake Bay Program. Both organizations are located in Annapolis, Maryland, the epicenter of bay conservation efforts. The program serves the Chesapeake Bay Partnership, the EPA, the Chesapeake Bay Commission, and the six watershed states of Delaware, Maryland, New York, Pennsylvania, Virginia, West Virginia, and the District of Columbia—along with 90 other partners including nonprofit organizations, academic institutions, and government agencies such as the National Oceanic and Atmospheric Administration, the U.S. Fish and Wildlife Service, the U.S. Geologic Survey (USGS), and the U.S. Department of Defense.
On behalf of this partnership, EPA in 2016 invested $1.3 million in state and federal funding in the Conservancy’s high-resolution land cover project, which is being developed with the University of Vermont. Information gleaned from several precision mapping pilot programs is already helping local governments and river partners make more efficient and cost-effective land-management decisions.
“There are a lot of actors in the Chesapeake Bay watershed,” says Joel Dunn, president and CEO of the Chesapeake Conservancy. “We’ve been working on a very complicated conservation problem as a community over the last 40 years, and the result has been layers and layers and many institutions built to solve this problem.”
“Now it’s not a collective will problem but an action problem, and the whole community needs to be partnering in more innovative ways to take restoration of the watershed’s natural resources to the next level,” he adds.
“Conservation technology is evolving quickly and may be cresting now,” Dunn says, “and we want to ride that wave.” The project is an example of the Conservancy’s efforts to take its work to new heights. By bringing “big data” into the world of environmental planning, he says, the Conservancy is poised to further innovate as “conservation entrepreneurs.”
What Is Precision Mapping Technology?
Land use and land cover (LULC) data from images taken by satellites or airplanes is critical to environmental management. It is used for everything from ecological habitat mapping to tracking development trends. The industry standard is the USGS’s 30-by-30-meter-resolution National Land Cover Database (NLCD), which provides images encompassing 900 square meters, or almost one-quarter acre. This scale works well for large swaths of land. It is not accurate, however, at a small-project scale, because everything at one-quarter acre or less is lumped together into one type of land classification. A parcel might be classified as a forest, for example, when that quarter-acre might contain a stream and wetlands as well. To maximize improvements to water quality and critical habitats, higher resolution imaging is needed to inform field-scale decisions about where to concentrate efforts.
Using publicly available aerial imagery from the National Agriculture Imagery Program (NAIP), combined with LIDAR (or Light Detection and Ranging) land elevation data, the Conservancy has created three-dimensional land classification datasets with 900 times more information and close to a 90 percent accuracy level, compared to a 78 percent accuracy level for the NLCD. This new tool provides a much more detailed picture of what’s happening on the ground by showing points where pollution is entering streams and rivers, the height of slopes, and the effectiveness of best management practices (BMPs) such as bioswales, rain gardens, and forested buffers.
“We’re able to translate raw imagery to a classified landscape, and we’re training the computer to look at what humans see at eye level,” and even to identify individual plants, says Jeff Allenby, director of conservation technology, who was hired in 2012 to leverage technology to study, conserve, and restore the watershed. In 2013, a $25,000 grant from the Information Technology Industry Council (ITIC) allowed Allenby to buy two powerful computers and begin working on the digital map. With support from the Chesapeake Bay Program, his geographic information system (GIS)-savvy team of eight has created a classification system for the Chesapeake watershed with 12 categories of land cover, including impervious surfaces, wetlands, low vegetation, and water. It is also incorporating zoning information about land uses from the Chesapeake Bay Program.
The Technology’s Potential
Precision mapping “has the potential to transform the way we look at and analyze land and water systems in the United States,” says James N. Levitt, manager of land conservation programs for the department of planning and urban form at the Lincoln Institute, which is supporting the Conservancy’s development of the technology with $50,000. “It will help us maintain water quality and critical habitats, and locate the areas where restoration activities will have the greatest impact on improving water quality.” Levitt says the technology enables transferring “nonpoint,” or diffuse and undetermined, sources of pollution into specific identifiable “point” sources on the landscape. And it offers great potential for use in other watersheds, such as the Ohio and Mississippi river systems, which, like the Chesapeake watershed, also have large loads of polluted stormwater runoff from agriculture.
It’s a propitious time to be ramping up conservation technology in the Chesapeake region. In February 2016, the U.S. Supreme Court decided not to consider a challenge to the Chesapeake Bay Partnership’s plan to fully restore the bay and its tidal rivers as swimmable and fishable waterways by 2025. The high court’s action let stand a ruling by the 3rd U.S. Circuit Court of Appeals that upheld the clean water plan and reinforced restrictions on the total maximum daily load, or the permissible limit of pollution from substances like nitrogen and phosphorus. These nutrients, found in agricultural fertilizers, are the two major pollutants of the bay, and are addressed under federal water quality standards established by the Clean Water Act. The ruling also allows EPA and state agencies to fine polluters for violating regulations.
The Chesapeake Bay’s water quality has improved from its most polluted phase in the 1980s. Upgrades and more efficient operations at wastewater treatment plants have reduced nitrogen going into the bay by 57 percent and phosphorus by 75 percent. But the watershed states are still in violation of clean water regulations, and increasing urban development calls for constant assessment and pollution reduction in water and critical habitats.
Pilot Project No. 1: Chester River
Backed by funding from ITIC’s Digital Energy and Sustainability Solutions Campaigns, the Conservancy completed a high-resolution land classification and stormwater runoff flow analysis for the entire Chester River watershed on Maryland’s eastern shore. Isabel Hardesty is the river keeper for the 60-mile-long Chester River and works with the Chester River Association, based in Chestertown, Maryland. (“River keeper” is an official title for 250 individuals worldwide who serve as the “eyes, ears, and voice” for a body of water.) The Conservancy’s analysis helped Hardesty and her staff understand where water flows across the land, where BMPs would be most effective, and which degraded streams would be best to restore.
Two-thirds of the Chester River watershed’s land cover is row crops. Row-crop farmers often apply fertilizer uniformly to a field, and the fertilizer runs off with stormwater from all over the site. This is considered nonpoint pollution, which makes it harder to pinpoint the exact source of contaminants flowing into a river—compared to, say, a pile of manure. The Conservancy’s team mapped the entire Chester watershed, noting where rain fell on the landscape and then where it flowed.
“With the naked eye, you can look at a field and see where the water is flowing, but their analysis is much more scientific,” says Hardesty. The map showed flow paths across the whole watershed, in red, yellow, and green. Red indicates higher potential for carrying pollutants, such as flow paths over impervious surfaces. Green means water is filtered, such as when it flows through a wetlands or a forested buffer, making it less likely to carry pollution. Yellow is intermediary, meaning it could go either way. The analysis has to be “ground-truthed,” says Hardesty, meaning the team uses the GIS analysis and drills down to an individual farm level to confirm what’s happening on a specific field.
“We are a small organization and have relationships with most of the farmers in the area,” says Hardesty. “We can look at a parcel of land, and we know the practices that farmers use. We’ve reached out to our landowners and worked with them on their sites and know where pollution may be entering streams. When we know a particular farmer wants to put a wetland on his farm, this land use and water flow analysis helps us determine what kind of BMP we should use and where it should be located.” The value of precision mapping for the Chester River Association, says Hardesty, has been “realizing that the best place to put a water intercept solution is where it’s best for the farmer. This is usually a fairly unproductive part of the farm.” She says farmers generally are happy to work with them to solve the problem.
The Chester River Association is also deploying the technology to use resources more strategically. The organization has a water monitoring program with years of watershed data, which the Conservancy team analyzed to rank streams according to water quality. The association now has GIS analysis that shows the flow paths for all stream subwatersheds, and is creating a strategic plan to guide future efforts for streams with the worst water quality.
Pilot Project No. 2: York County Stormwater Consortium BMP Reporting Tool
In 2013, the Conservancy and other core partners launched Envision the Susquehanna to improve the ecological and cultural integrity of the landscape and the quality of life along the Susquehanna River, from its headwaters in Cooperstown, New York, to where it merges with the Chesapeake Bay in Havre de Grace, Maryland. In 2015, the Conservancy selected the program to pilot its data project in York County, Pennsylvania.
Pennsylvania has struggled to demonstrate progress in reducing nitrogen and sediment runoff, especially in places where urban stormwater enters rivers and streams. In 2015, EPA announced that it would withhold $2.9 million in federal funding until the state could articulate a plan to meet its targets. In response, the Pennsylvania Department of Environmental Protection released the Chesapeake Bay Restoration Strategy to increase funding for local stormwater projects, verify the impacts and benefits of local BMPs, and improve accounting and data collection to monitor their effectiveness.
York County created the York County–Chesapeake Bay Pollution Reduction Program to coordinate reporting on clean-up projects. The Conservancy’s precision mapping technology offered a perfect pilot opportunity: In spring 2015, the York County Planning Commission and the Conservancy began working together to improve the process for selecting BMP projects for urban stormwater runoff, which, combined with increased development, is the fastest growing threat to the Chesapeake Bay.
The planning commission targeted the annual BMP proposal process for the 49 of 72 municipalities that are regulated as “municipal separate storm sewer systems,” or MS4s. These are stormwater systems required by the federal Clean Water Act that collect polluted runoff that would otherwise make its way into local waterways. The commission’s goal was to standardize the project submittal and review processes. The county had found that calculated load reductions often were inconsistent among municipalities because many lacked the staff to collect and analyze the data or used a variety of different data sources. This made it difficult for the commission to identify, compare, and develop priorities for the most effective and cost-efficient projects to achieve water-quality goals.
How to Use the York County Stormwater Consortium BMP Reporting Tool
To use the online tool, users select a proposed project area, and the tool automatically generates a high-resolution land cover analysis for all of the land area draining through the project footprint. High-resolution data is integrated into the tool, allowing users to assess how their project would interact with the landscape. Users also can compare potential projects quickly and easily, and then review and submit proposals for projects with the best potential to improve water quality. Users then input their project information into a nutrient/sediment load reduction model called the Bay Facility Assessment Scenario Tool, or BayFAST. Users enter additional project information, and the tool fills in the geographic data. The result is a simple, one-page pdf report that outlines the estimated project costs per pound of nitrogen, phosphorus, and sediment reduction. See the tool at: http://chesapeakeconservancy.org/apps/yorkdrainage/.
The Conservancy and planning commission collaborated to develop the user-friendly, web-based York County Stormwater Consortium BMP Reporting Tool (above), which allows different land use changes and restoration approaches to be compared and analyzed before being put into place. The Conservancy, commission, and municipal staff members collaborated on a uniform template for the proposals and data collection, and they streamlined the process with the same data sets. The Conservancy then trained a few of the local GIS professionals to provide technical assistance to other municipalities.
“It’s easy and quick to use,” explains Gary Milbrand, CFM, York Township’s GIS engineer and chief information officer, who is a project technical assistant for other municipalities. In the past, he says, municipalities typically spent between $500 and $1,000 on consultants to analyze their data and create proposals and reports. The reporting tool, he says, “saves us time and money.”
The commission required all regulated municipalities to submit BMP proposals using the new technology by July 1, 2016, and proposals will be selected for funding by late fall. Partners say the municipalities are more involved in the process of describing how their projects are working in the environment, and they hope to see more competitive projects in the future.
“For the first time, we can compare projects ‘apples to apples,’” says Carly Dean, Envision the Susquehanna project manager. “Just being able to visualize the data helps municipal staffs analyze how their projects interact with the landscape, and why their work is so important.” Dean adds, “We’re only just beginning to scratch the surface. It will take a while before we grasp all of the potential applications.”
Integrating Land Cover and Land Use Parcel Data
The Conservancy team is also working to overlay land cover data with parcel-level county data to provide more information on how land is being used. Combining high-resolution satellite imagery and county land use parcel data is unprecedented. Counties throughout the United States collect and maintain parcel-level databases with information such as tax records and property ownership. About 3,000 out of 3,200 counties have digitized these public records. But even in many of these counties, records haven’t been organized and standardized for public use, says McCarthy.
EPA and a USGS team in Annapolis have been combining the one-meter-resolution land cover data with land use data for the six Chesapeake states to provide a broad watershed-wide view that at the same time shows highly detailed information about developed and rural land. This fall, the team will incorporate every city and county’s land use and land cover data and determine adjustments to make sure the high-resolution map data matches local-scale data.
The updated land use and cover data then will be loaded into the Chesapeake Bay Watershed Model, a computer model now in its third of four beta versions of production and review. State and municipal partners, conservation districts, and other watershed partners have reviewed each version and suggested changes based on their experience in stormwater mitigation, water treatment upgrades, and other BMPs. Data will detail, for example, mixed-use development; different agricultural land uses for crops, hay, and pasture; and measures such as how much land produces fruit or vegetable crops. That’s where the conversion from land cover to land use comes in to help specify the pollution load rates.
“We want a very transparent process,” says EPA’s Rich Batiuk, associate director for science, analysis, and implementation for the Chesapeake Bay Program, noting that the combined land cover and land use data will be available online, at no cost. “We want thousands of eyes on land use and cover data. We want to help state and local partners with data on how we’re dealing with forests, flood plains, streams, and rivers. And we want an improved product that becomes the model for simulations of pollution control policies across the watershed.”
Scaling Up and Other Applications
As the technology is refined and used more widely by watershed partners, the Conservancy hopes to provide other data sets, scale up the work to other applications, and conduct annual or biannual updates so the maps reflect current conditions. “This data is important as a baseline, and we’ll be looking at the best way to be able to assess change over time,” says Allenby.
Watershed partners are discussing additional applications for one-meter-resolution data, from updating Emergency-911 maps, to protecting endangered species, to developing easements and purchasing land for conservation organizations. Beyond the Chesapeake, precision mapping could help conduct continental-scale projects. It offers the conservation parallel to precision agriculture, which helps determine, for example, where a bit of fertilizer in a specific place would do the most good for plants; the two combined could increase food production and reduce agriculture’s environmental impact. The technology could also help with more sustainable development practices, sea level rise, and resiliency.
Many people said it wasn’t feasible for a small nonprofit to do this kind of analysis, says Allenby, but his team was able to do it for a tenth of the cost of estimates. The bigger picture includes making land use and cover data available to the public for free. But that’s an expensive proposition at this point: The data needs backup, security, and a huge amount of storage space. Working with Esri, a Redlands, California-based company that sells GIS mapping tools, as well as Microsoft Research and Hexagon Geospatial, the Conservancy team is transferring the data. The process now runs linearly one square meter at a time. On a cloud-based system, it will run one square kilometer at a time and distribute to 1,000 different servers at once. Allenby says this could allow parcel-level mapping of the entire 8.8 million square kilometers of land in the United States in one month. Without this technology, 100 people would have to work for more than a year, at much greater cost, to produce the same dataset.
Precision mapping could bring greater depth to State of the Nation’s Land, an annual online journal of databases on land use and ownership that the Lincoln Institute is producing with PolicyMap. McCarthy suggests the technology might answer questions such as: Who owns America? How are we using land? How does ownership affect how land is used? How is it changing over time? What are the impacts of roads environmentally, economically, and socially? What changes after you build a road? How much prime agricultural land has been buried under suburban development? When does that begin to matter? How much land are we despoiling? What is happening to our water supply?
“Can it solve big social problems?” queries McCarthy. One of biggest outcomes of precision mapping technology would be to develop better ways to inform land use practices, he says, especially at the interface between people and land, and water and land. Land records are needed to use this technology most effectively, which might be challenging in some places because these records don’t exist or are inconsistent. But it’s a methology and technology that can be used in other countries, he says. “It‘s a game changer, allowing us to overlay land use data with land cover data, which could be hugely valuable to rapidly urbanizing places like China and Africa, where patterns and changes will be seen over the land and over time. It’s hard to exaggerate the impact.”
“Our goal is the world, to use this technology for transparency and accountability,” says McCarthy. “The more information planners have access to, the better stewards we can be for the planet.” The tool should be shared with “people who want to use it for the right purposes, so we’re making the value proposition that this is a public good that we all need to maintain,” he says, similar to the way USGS developed GIS.
“We need the right public-private arrangement, something like a regulated public utility with public oversight and support that will maintain it as a public good.”
Kathleen McCormick, principal of Fountainhead Communications, LLC, lives and works in Boulder, Colorado, and writes frequently about sustainable, healthy, and resilient communities.
Image by The Chesapeake Conservancy

Land readjustment is a vital but difficult and time-consuming process: formulating a sort of retroactive version of planning in neighborhoods that developed informally, with unsanctioned dwellings chaotically built in ways that leave some with no access to streets and paths. According to UN-Habitat, 863 million people around the world lived in such settings as of 2014, and the number could rise to 3 billion by 2050. The agreed draft of the New Urban Agenda for the Habitat III conference in Quito, Ecuador, notes that the “rising number of slum and informal settlement dwellers” contributes to intense challenges that exacerbate global poverty and its risks, from a lack of municipal services to increased health threats.
But evolving technology may facilitate revision of these organic layouts in ways that lead to minimal displacement and speed the absorption of such neighborhoods into a city’s formal structure, thus providing residents basic services—from sanitation and drainage systems to access for fire and medical emergencies. One of the more promising tools is Open Reblock, a platform currently in a pilot phase in areas around Cape Town, South Africa, and Mumbai, India. The project stems from a collaboration among Shack/Slum Dwellers International (SDI, is a network of urban-poor communities in 33 countries), the Santa Fe Institute (SFI, a nonprofit research and education organization), and Arizona State University.
SDI has long been involved in grassroots “reblocking”—essentially another way of characterizing the land-readjustment process. Luís Bettencourt, a professor of complex systems at the Santa Fe Institute, explains that his group, which focuses on “cities as systems,” began working with SDI a few years ago. There was a useful convergence in the high-level, statistics-and-data thinking of the SFI group with the on-the-ground “census” efforts SDI used in its work with informal-settlement communities.
SDI’s reblocking efforts could be painstaking. Residents led the process of mapping a neighborhood—on paper. Then they gathered at community meetings, arranged cutouts representing every local structure over that map, and began shifting them around to devise new paths and roadways. While this active collaboration was profoundly beneficial, the analog methodology wasn’t exactly speedy.
Ever-more-accessible digital technology has in recent years eased the process, says SDI Programme Officer: Data Management Anni Beukes. The group now uses a geographic information system (GIS) tool to map settlement boundaries and services available, and then relies on a separate tool for detailed household-level surveys and precise measurements of every structure. Given the wide availability of mobile devices, the process is open to—and indeed dependent on—direct resident participation.
Enrique R. Silva, research fellow and senior research associate at the Lincoln Institute, notes that similar tech-mapping tools are impacting such efforts around the world. “You can map something almost immediately,” he says, and involve community members in that process. He points to efforts, backed by the Lincoln Institute and others, that rely on “cheap and universal” devices and crowd-sourcing tools to reach similar goals across Latin America.
A master map that is available in digital form also creates new possibilities. Open Reblock is an example. It deploys a custom algorithm to read a digital map of an informal settlement and propose what it sees as the optimal strategy for reblocking it. (The algorithm is written to prioritize existing roadways and structures, echoing the traditional goal of minimizing displacement.) This process takes just minutes, at most.
“When I first showed it to our communities, they said, ‘You’re taking our paper cutouts away’!” Beukes says with a laugh. They weren’t wrong—and they weren’t actually protesting. (“At least the younger ones weren’t; some older participants,” she adds, “can be hesitant in their uptake of new technology.”)
But what Open Reblock produces is not meant to be a strict directive or an end point—community members can still tweak the results based on their direct knowledge and concerns. Indeed, Open Reblock depends on such participation—“creating a shared reality where people can play and create this future reality,” Bettencourt says. “It’s basically a town-planning tool, at the level of a neighborhood.” And by offering “a proof of principle and a starting point” for negotiations, he adds, it radically speeds up one of the toughest steps in the process.
Beukes says participants in the pilot programs have reacted with enthusiasm toward the new possibilities of this system. It means that a final plan will exist in a form that city officials can respond to more easily, and it ensures that all parties are considering the same geospatial data and planning scheme. “It’s a template for discussion,” Bettencourt adds, one that “puts everyone literally on the same map.”
With a grant from Open Ideo, Bettencourt’s team and SDI are working to improve the design of Open Reblock’s interface, with feedback from community participants in Cape Town and Mumbai. The entire project is being created in open-source code (available on Github), both to encourage improvements from anyone who wants to be involved and to make it easier to scale up future versions for widespread use anywhere.
The project is, of course, not a magic solution. Land readjustment can be contentious, and Silva points out that important issues around the value of any given settlement dweller’s property must still be worked out on a more individual, human level. Bettencourt and Beukes agree that Open Reblock is a supplement to, not a substitute for, existing processes.
Still, Bettencourt points to UN-Habitat numbers to speculate that there may be a million neighborhoods around the world in need of reblocking. “That’s a scary number,” he says. And it adds to the sense among some observers that there’s just something impossible about the effort—particularly when, on a case-by-case basis, the process gets bogged down over time.
But all this may be less intimidating from a technologist perspective. Think of the mapping and data-collection tools that have emerged in recent years as an early step that builds on the long-existing work of SDI and others. Open Reblock is just one more iteration of that trajectory. “I think we have all the ingredients, but we have to start doing,” Bettencourt says. “If there’s a system to capture the data and run proposals on top of it, that’s a big step. It doesn’t create the change, but it helps.”
Rob Walker (robwalker.net) is a contributor to Design Observer and The New York Times.
Leaflet | Map data © OpenStreetMap contributors, CC-BY-SA, Imagery © Mapbo