Una versión más actualizada de este artículo está disponible como parte del capítulo 7 del CD-ROM Perspectivas urbanas: Temas críticos en políticas de suelo de América Latina.
Francisco Sabatini, sociólogo y urbanista, es profesor de la Universidad Católica de Chile en Santiago, donde imparte cursos de planificación y estudios urbanos y realiza investigaciones en segregación residencial, captura de plusvalías y conflictos ambientales. Sabatini combina sus labores académicas con trabajos de investigación para organizaciones no gubernamentales y proyectos de acción en aldeas y barriadas. Tras el retorno de Chile a la democracia en 1990, se desempeñó en los gobiernos democráticos subsiguientes como asesor del Ministro de Vivienda y Urbanismo de Chile y como miembro del Consejo Consultivo Nacional del Medio Ambiente. Es autor de numerosas publicaciones en libros y revistas y ha ejercido la docencia en varios países principalmente de América Latina. Durante largo tiempo ha colaborado para el Programa para América Latina y el Caribe del Instituto Lincoln como autor de cursos, instructor e investigador.
Land Lines: ¿Por qué es tan importante el tema de la segregación residencial para la política de suelos y la planificación urbana en general?
Francisco Sabatini: La zonificación —instrumento básico de la planificación urbana— consiste en segregar o separar actividades y consolidar áreas urbanas homogéneas con propósitos ya sea de exclusión o bien de inclusión. A nivel municipal, esta herramienta de planificación fue introducida en Frankfurt, Alemania, en 1891 y se adoptó en otros sitios para hacer frente a los problemas ambientales y sociales resultantes de la urbanización e industrialización aceleradas. En las ciudades modernas, el uso difundido de la zonificación para separar actividades y grupos diferentes ha exacerbado éstos y otros problemas. Ha empeorado el tráfico y la contaminación del aire debido al aumento de los viajes en automóvil para desplazarse por la ciudad, y contribuido al deterioro ambiental y a la formación de guetos urbanos plagados de diversos síntomas de desintegración social como son índices crecientes de deserción escolar, embarazo de adolescentes y drogadicción.
Indudablemente el afán en pro de la segregación social ha sido por largo tiempo un componente de la zonificación excluyente, junto con planteamientos referentes a los riesgos ambientales y sanitarios. La afluencia de familias de clase obrera e inmigrantes suele considerarse indeseable y amenazadora desde el punto de vista político, y la zonificación ha servido para segregar dichos grupos. Las formas más negativas de la segregación social son la discriminación étnica y religiosa. Cuando un gobierno nacional se autodefine en términos religiosos, étnicos o raciales, la segregación residencial suele enraizarse como una severa manifestación de la discriminación, la intolerancia y explotación humana, tal como ocurre en Irlanda, Sudáfrica e Israel. No obstante, la segregación puede ser positiva, como es el caso de muchas ciudades del mundo en donde la proliferación de enclaves étnicos ha sido un elemento de enriquecimiento social.
LL: ¿Cuáles son los impactos económicos de la segregación?
FS: Además de sus efectos urbanos y sociales, la segregación residencial es un aspecto importante de la política de suelos porque está estrechamente relacionada con el funcionamiento de los mercados del suelo y motiva a las familias a ir en busca de seguridad económica y de formar activos intergeneracionales. En las ciudades de rápido crecimiento de economías inestables y tradición inflacionaria, los aumentos en el precio del suelo se convierten en una oportunidad para que hogares de todos los niveles sociales alcancen sus metas. No es por casualidad que el porcentaje de propietarios de viviendas sea comparativamente alto en las ciudades latinoamericanas, incluso en los sectores pobres. La valoración del suelo parece ser una motivación importante de los procesos de autosegregación de las clases media y alta. Además, el aumento de los precios del suelo limita el acceso al suelo urbanizado y contribuye a la segregación espacial. De hecho, las investigaciones realizadas por el Instituto Lincoln indican que el problema principal del suelo en las ciudades latinoamericanas es la escasez de terrenos urbanizados costeables, más que la escasez del suelo en sí misma.
LL: ¿Por qué es tan importante la segregación residencial en América Latina?
FS: Dos de las características más sobresalientes del panorama latinoamericano son la desigualdad socioeconómica y la segregación residencial urbana. Si bien es cierto que existe una relación obvia entre ambos fenómenos, el uno no es un mero reflejo del otro. Por ejemplo, los cambios en la desigualdad del ingreso en las ciudades brasileñas no vienen necesariamente acompañados por cambios equivalentes en la segregación espacial. No obstante, la segregación residencial tiene estrecha relación con los procesos de diferenciación social, y en ese sentido está profundamente arraigada en las ciudades de economías diversas de la región.
El explosivo aumento del índice de delitos y problemas sociales asociados de los barrios pobres segregados espacialmente ha convertido la segregación en un asunto político crítico. Pareciera que estos barrios están evolucionando de la fase de “pobreza esperanzadora” que predominaba antes de las reformas económicas de la década de 1980, al ambiente desolador y sin esperanza de los guetos urbanos. Cuánto de este cambio se debe a la segregación residencial, es algo que no se sabe a ciencia cierta ni se ha investigado en profundidad. Yo creo que en el ambiente actual de regímenes laborables “flexibles” (sin contratos, sin control de reglamentos laborales, etc.) y de alienación de la sociedad civil de las políticas formales, la segregación residencial agrega un nuevo componente a la exclusión social y a la desolación. En el pasado, la aglomeración espacial de los pobres tendía a ser soporte de las organizaciones sociales de los pobladores y a potenciar su función dentro de un sistema político predominantemente elitista.
LL: ¿Qué características presenta la segregación residencial en América Latina en contraste con el resto del mundo?
FS: En comparación con sociedades caracterizadas por una fuerte movilidad social (p. ej., Estados Unidos), la segregación espacial en América Latina se usa con menos frecuencia como medio para destacar identidades sociales y étnicas. Brasil, al igual que los Estados Unidos, tiene una historia de esclavitud y altos niveles de inmigración, y es además una de las sociedades más dispares del mundo; sin embargo, en las vecindades residenciales del Brasil parece haber mucha menos segregación étnica o de renta que en los Estados Unidos.
Al mismo tiempo, las élites y la clase media en ascenso de las ciudades latinoamericanas se concentran en las áreas pudientes, aunque en muchos casos estas áreas tienen también una gran diversidad social dado que grupos de bajos recursos se mudan fácilmente a ellas, en agudo contraste con la tradición de los adinerados suburbios angloamericanos, que tienden a conservar su homogeneidad social y económica con el paso del tiempo.
Otro patrón espacial digno de mencionar es que los barrios pobres segregados de América Latina están predominantemente situados en la periferia de las ciudades, en semejanza a lo que ocurre en Europa continental y a diferencia de muchas ciudades angloamericanas, cuyos pobres se concentran en el centro. En América Latina, las poderosas clases altas han instituido reglamentos y códigos urbanos, como también influenciado las inversiones públicas con objeto de excluir al pobre “informal” de algunas de las zonas más modernas. Esta exclusión esconde en cierto modo el subdesarrollo de sus ciudades y países.
Finalmente, la existencia de una cultura cívica de integración social en América Latina se manifiesta en un ambiente físico de mezclas sociales que podría tener relación con la tradición católica y el fenómeno del mestizaje. El mestizo es una figura importante en la historia latinoamericana. Vale la pena destacar el hecho de que en el idioma inglés no exista el equivalente de la palabra mestizo, y que pareciera que las ciudades protestantes angloamericanas están renuentes a estimular las mezclas sociales y espaciales. Las políticas de suelo que busquen impedir la formación de los guetos urbanos pobres deberían abocarse a expandir esta herencia cultural latinoamericana que podría además influir sobre la segregación residencial en otros lugares.
LL: ¿Qué tendencias observa usted en cuanto a la segregación residencial en América Latina?
FS: Hay dos tendencias mayoritarias, ambas estimuladas por las reformas económicas de la década de 1980: (1) el desplazamiento de los adinerados barrios cerrados (“urbanizaciones enrejadas”) y otros megaproyectos hacia áreas periféricas de bajos recursos; y (2) la proliferación de la desintegración social (“efecto gueto”) en las vecindades marginales. La invasión de la periferia urbana por grandes proyectos de construcción estimula la elitización de zonas que de otra manera probablemente terminarían como asentamientos de bajos recursos, y produce cuantiosas ganancias para algunos. También acorta la distancia física entre los pobres y otros grupos sociales, a pesar de que esta nueva forma de segregación residencial es más pronunciada debido a la alta homogeneidad de quienes viven en los barrios cerrados y a que la presencia de muros o cercas refuerza la imagen de exclusión. Debido a la situación periférica de estos nuevos proyectos, los procesos de elitización deben estar apoyados por infraestructuras regionales modernas, principalmente caminos. Si un buen número de los habitantes pobres fuera propietario de los suelos, se podría impedir su completa expulsión de estas áreas elitizadas y alcanzar un mayor grado de diversidad social.
La segunda tendencia consiste en la desintegración social de esas vecindades pobres donde se ha agregado la exclusión económica y política a la segregación espacial tradicional, tal como se mencionó anteriormente.
LL: ¿Qué deberían saber los funcionarios de política de suelos de América Latina y otras regiones acerca de la segregación residencial, y por qué?
FS: La segregación residencial no es un subproducto necesario de los programas de viviendas populares ni del funcionamiento de los mercados del suelo, ni tampoco es un reflejo espacial obligatorio de la desigualdad social. Las políticas de suelo orientadas a controlar la segregación residencial podrían contribuir a detener la expansión del “efecto gueto”. Además, las autoridades deberían considerar instituir medidas dirigidas a democratizar la ciudad, en especial en lo que se refiere a la distribución de inversiones en la infraestructura urbana. Políticas tales como el presupuesto participativo implementado en Porto Alegre y otras ciudades brasileñas podrían ser indispensables para ayudar a combatir uno de los pilares de la segregación residencial de las ciudades latinoamericanas, a saber: las inversiones públicas sesgadas hacia las áreas adineradas.
LL: ¿De qué manera aborda estos problemas su trabajo con el Instituto Lincoln?
FS: La segregación residencial, a pesar de ser ampliamente reconocida como un asunto urbano de importancia, ha sido escasamente investigada en el ambiente académico y mayormente descuidada por las autoridades de políticas de suelos. Con el apoyo del Instituto, he estado dando clases sobre el tema en varias universidades latinoamericanas durante el último año para promover la discusión entre profesores y alumnos de departamentos de planificación urbana y desarrollo del suelo. Asimismo, dirijo una red de expertos que recientemente preparó un curso de ocho sesiones sobre segregación residencial y mercados del suelo en ciudades de América Latina y que ofrecemos en formato de CD-ROM para funcionarios y educadores, con el objeto de apoyar la enseñanza, investigación y discusión sobre este tema.
LL: ¿Puede explicarnos su nueva función como socio del Instituto Lincoln en Chile?
FS: Este año inauguramos el Programa de Apoyo al Diseño de Políticas Urbanas de la Universidad Católica de Chile en Santiago. El consejo directivo del programa está formado por miembros del parlamento, funcionarios de alta jerarquía, líderes comerciales, investigadores, asesores y representantes de organizaciones no gubernamentales. Con su enfoque en la política de suelos, particularmente en el financiamiento del desarrollo urbano e integración social residencial, este consejo se encargará de identificar objetivos importantes de la política de suelo y estrategias adecuadas para lograrlos, incluidas actividades en los aspectos de capacitación, investigación de política aplicada y difusión de los resultados.
La primera tarea del consejo es estimular y ampliar la discusión del proyecto de reforma de las principales políticas y leyes urbanas, enviado recientemente por el gobierno al parlamento chileno. A partir de la implementación de las políticas de liberalización de los mercados de suelo urbano durante la dictadura militar a finales de los 70, prácticamente se había eliminado el debate sobre las políticas urbanas y Chile había perdido su posición de liderazgo regional en tales asuntos. A esta falta de discusión han contribuido las nociones excesivamente simplistas que hay sobre la operación y el potencial de los mercados del suelo, y especialmente —debido, en parte, al sesgo ideológico— sobre los orígenes de la segregación residencial. Es necesario visualizar tanto los mercados del suelo como los procesos de segregación residencial como escenarios de importancia urbana y social crítica. Queremos reintroducir a Chile en este debate, y en la última década hemos contado con la ayuda del Programa para América Latina y el Caribe del Instituto Lincoln y de sus redes de expertos para lograr ese objetivo.
Referencias y recursos
Sabatini, Francisco, y Gonzalo Cáceres. 2004. Barrios cerrados: Entre la exclusión y la integración residencial (Gated communities: Between exclusion and residential integration). Santiago: Instituto de Geografía, Pontificia Universidad Católica de Chile.
———. Próxima publicación. Recuperación de plusvalías en Santiago de Chile: Experiencias del Siglo XX. (Value capture in Santiago, Chile: Experiences from the 20th century). Santiago: Instituto de Geografía, Pontificia Universidad Católica de Chile.
Sabatini, Francisco, Gonzalo Cáceres y Gabriela Muñoz. 2004. Segregación residencial y mercados de suelo en la ciudad latinoamericana. (Residential segregation and land markets in Latin American cities). CD-ROM.
Espaço e debates. 2004. Segregações urbanas 24(45).
As the capital city of China, Beijing is not only the nation’s political, cultural, scientific and educational center, but also one of the leading growth machines in the country. The city has experienced double-digit growth in its gross domestic product (GDP) for at least the last decade, and government revenues have increased at rates between 18 and 30 percent in recent years. Real estate has been one of the most important sectors of economic growth since the mid-1990s, with public and private investment leading to improved urban infrastructure, intense demands for housing and increased land consumption. This rapid growth has fundamentally changed the physical pattern of the city, both in the existing built-up central areas and throughout the municipal region.
At this time of transformation from a planned economy to a market economy, Chinese urban planners are reviewing the existing planning methodology and urban systems. This article reports on efforts by the Beijing municipal government and its planning commission to control and manage urban growth during this transition and to plan for the future.
The Current Urban Pattern
Beijing is one of four municipalities in the People’s Republic of China with provincial-level status directly under the central government. Covering an area of 16,400 square kilometers (km), Beijing has under its jurisdiction 16 districts and two counties. It is the second largest city in China with a population of more than 14 million, including about 11 million permanent residents and several million temporary residents.
Geographically Beijing is located on the North China Plain, but economically it has been considered part of the coastal zone. Since the national economic development strategy of the 1980s, three major economic zones along the coast have been in the forefront of reforms: the Pearl River Delta including Hong Kong, Guangzhou and Shengzhen; the Yangtze River Delta including Shanghai; and the Bohai Bay area including Beijing and Tianjin. Comparing their economic development patterns, Bohai Bay remains behind the others in regional development and cooperation. Unbalanced development and the gap between urban and rural development are the major issues needing attention.
Although regional development has been included in the national economic strategy, previous and current urban planning has not addressed spatial patterns on a regional scale. Beijing’s current comprehensive plan, which was approved by the State Council in 1993, still reflects the influence of the former Soviet Union in the 1950s. Comprehensive planning is a major tool used by municipal and local governments to control, monitor or guide urban development in China as elsewhere. But, because of inefficient implementation policies and slow procedures for updating the plans, they have not kept up with the rapid development of recent decades. There are six distinct sectors in Beijing’s current plan (see Figure 1).
Historic City Core: The heart of Beijing is the 62 square km historic core, which has served as the capital city for nearly 800 years. With a population of 1.3 million, this historic area is being significantly transformed as modern urban functions put pressure on preservation efforts.
Central Built-up Area: Surrounding the historic core is the 300 square km city center that has been developed gradually the since 1950s. After the market for land use rights was established in the 1980s, this area has been redeveloped rapidly and in the process has changed the physical image and socioeconomic life of Beijing. Most industrial land has been converted into a central business district of commercial and residential neighborhoods. Meanwhile, development on the outer edge of this area has been expanded more than 25 percent within the last 10 years, and the population has increased to 5 million.
Inner Greenbelt: A planned greenbelt area of 300 square km was established in the city’s 1982 comprehensive plan, but the 1993 plan showed the area reduced to about 240 square km. The objective of the greenbelt was to define the edge of the central area and provide adjacent open space. Without appropriate implementation policies and funding, however, this greenbelt (including important agriculture land) has been continually encroached upon by urban development. At the end of 2002 about half of the planned open space was made available for residential development and now only about 100 square km of open space remains.
Scattered Districts: Ten scattered districts were created in the comprehensive plan of 1982 as inner suburban development areas. Some of them have benefited from large investments in housing, but they remain primarily bedroom communities lacking mixed-used development, employment opportunities, public transportation and other services. The planned population for each of these districts was about 200,000, but several districts on the north and northeastern edge have already reached 500,000.
Satellite Towns: In the outer suburban area 14 satellite towns were planned to be self-sufficient centers combining employment and housing functions. Several factors contributed to the initial failure of this plan, however: the city center and its expansion area continued to attract most of the investment because of its existing infrastructure and lower development costs; the new market economy could not control strong linkages between employment and housing; the public transportation system could not support the development of these satellite towns; and people demonstrated a cultural preference for living in the dense urban center.
In other words, the original planned polycentric pattern neglected the impact of market forces and sociocultural preferences. Significant urban development did not reach the satellite towns until the late 1990s, when the municipal government built radial highways and created some university and industrial zones. Nevertheless, the physical pattern of urbanization around Beijing remains monocentric in character.
The Ring and Radial Highway System: To support the city’s planned spatial structure, the concept of a ring and radial road system was created in the 1950s and strengthened in the 1982 and 1993 comprehensive plans. The system was considered to be an ideal transportation model to support the planned urban pattern. The 4th ring road would be the edge of the city center; the 5th ring road would link the 10 scattered districts; and the 6th ring road was designed as the intercity highway to connect some of the 14 satellite towns. The radial highways were planned to provide rapid access between the ring roads and to create traffic corridors between Beijing and other cities.
Impacts on Urban Spatial Structure and Planning
China’s rapid economic growth has provided more income for both municipal government and citizens, fundamentally shifting consumption patterns in a very short time. The demands for housing and automobiles, in particular, have exceeded all expectations. Numerous large redevelopment projects in the city center have replaced old industrial buildings and many traditional houses with large-scale commercial complexes, modern apartment buildings, and the road and highway systems. Generally, the planned polycentric pattern of equally sized satellite towns has not been a workable structure to manage the city’s rapid urban growth, and the 1993 comprehensive plan has not been able to guide rampant urbanization. Nevertheless, some planning and policy-making efforts have attempted to control physical growth and solve serious transportation problems.
Spatial Expansion and Growth Control: Under the two types of land ownership in China—state-owned urban land and collectively owned rural land—land use rights are separated from ownership. After the 1980s, urban land use rights could be transferred in the land market, making land the major resource by which local government could raise revenues to finance urban infrastructure and redevelopment. But, dependence on revenues from the leasing of state-owned land is not sustainable over the long term because all leasehold fees are collected once at the beginning of the lease term (generally 40 years for commercial property, 50 years for industrial property and 70 years for residential property). Without a large source of annual revenue from a property tax or other fees, local governments need to find more land to develop in order to generate new revenues. As a result, many local governments are motivated to create an oversupply of land, thus accelerating the acquisition of rural agricultural land.
In Beijing, an average of 20 square km of land was acquired for urban development annually between 1990 and 2000, but this figure reached 50 square km after 2000 and is expected to more than double during this decade. At this rate, to reach the municipal economic goal of tripling the GDP growth rate by 2010, there will be hardly any agricultural land left in the municipal area. Facing these challenges to sustainable urban development, the central and the municipal governments are initiating some urban planning efforts to control land consumption and redefine greenbelt areas.
To preserve the nation’s limited agriculture land resources, the central government in the 1980s set up an urban planning regulation of 100–120 square meters of urban land per person in a large city. For example, if Beijing’s comprehensive plan has an urban population forecast of 10 million in 2010, the city’s total urbanized land area should be controlled within 1,200 square km.
The population forecast is a crucial factor in determining urban land scale and controlling land consumption. However, after the national population policy became more flexible in accepting temporary urban residents in the 1990s, this population planning norm became much more difficult to attain in practice. There is no workable analytical method to review and evaluate urban population forecasts. As a result, it is difficult to control the oversupply of land by local governments, which can use their forecasts to enlarge their planned land development territory.
The inner greenbelt was not fully realized in the 1993 comprehensive plan, but it is still considered a workable planning approach for designating the urban edge. When construction of the 5th and 6th ring roads started in 2000, however, development of land around the roads began immediately, spreading primarily from the central city. In 2001 the Beijing municipal planning commission submitted a new “outer” greenbelt plan to the municipal government, defining nine large corridors connecting outer-suburban open spaces with inner-suburban green areas. The purpose is to define the boundaries for urban growth and to link the central city with the natural environment. However, there are more challenges for implementation: urbanization and urban development pressure within these green corridors affects hundreds of villages and nearly a million peasants; and it has been difficult to define the types of open space that are both ecologically sensitive and economically sustainable.
Transportation Planning: The transportation system planned in the early 1980s and modified in the early 1990s has been implemented; however, the road hierarchy system, consisting of urban highways, main motorways, sub-motorways and streets, did not anticipate such a rapid increase in the number of automobiles. Beijing is the leading city in China for automobile use, with an annual increase in car ownership of 15 to 20 percent. The city had one million vehicles in 1997, but the second million was added in only five years, from 1998 to 2003. Most people agree that the constant traffic jams are caused by the inappropriate transportation system and inadequate regulatory policies.
When the market demand for automobiles began to increase in the mid-1990s, the municipal government decided to speed up construction of the planned highways and motorways. Most of the public budget for infrastructure went into this road construction, and within three years the 4th and 5th and most of the 6th ring roads were completed. Transportation engineers insisted on completing the road system as planned, in spite of two commonly accepted arguments: dependence on the inner-city highway network caused more traffic congestion and negative impacts on the central urban fabric; and transportation planning without considering land use planning causes conflicts in the urban spatial structure.
Realizing that public transportation is a key solution to reducing traffic jams and managing the city more efficiently, the municipal government started to focus on building its subway and urban light-rail systems in 2001, after Beijing won its bid for the 2008 Olympic Games. The plan is to build four or five subway lines in the city center and four urban light-rail lines connecting to the suburban areas. To obtain sufficient funding for these very costly projects, the municipal government adopted a public-private partnership model to raise investment from the private sector. Although it is too early to tell how much these efforts may affect other aspects of urban development, it is clear that they cannot yield sustainable development without broader regional collaboration.
Beijing Urban Spatial Development Strategy Study
Several factors have prompted the City of Beijing to review its spatial structure on a regional scale.
Reforming the city’s physical spatial structure based on a consideration of the larger Bohai Bay region is fundamental to solving these problems. Furthermore, the major public tool to manage urban development, the existing comprehensive planning methodology, is being challenged by the market economy, which makes it more difficult to estimate future urban development demand.
Some Western urban researchers have pointed out problems in the Chinese comprehensive planning process, suggesting that it is too static; is too focused on physical and land use planning; neglects the costs of development and infrastructure; and takes too long for implementation and approval. Recognizing the increasing strength of market forces, planners and government officials constantly search for solutions to better balance their respective roles. The Beijing municipal government thus has started an urban spatial development strategy study outside the existing urban planning system to explore fundamental urban forms derived from market principles.
A Vision for the Future: As China’s capital city, Beijing is the nation’s political and cultural center. To raise its competitiveness and become a world city, however, Beijing needs to improve its built environment so it can host more national and international events in the areas of international trade and finance, education and tourism. Beijing’s spatial structure and infrastructure capacity also should support more urban functions using its regional industrial base and international transportation and port facilities. Population is a key element in measuring urban scale, but the more flexible national population policies since the late 1990s have made it difficult to provide accurate estimates. One critical step is to analyze the “carrying capacity” of environmental resources such as land and water, which can limit the city’s future growth and urban scale.
Urban Density: Density is another important issue in this study. Beijing’s population density of 150 persons/hectare (ha) in built-up areas (roughly within the 4th ring road) compares unfavorably with most other large cities in China: Shanghai–280 persons/ha; Tianjin–230 persons/ha; Guangzhou–360 persons/ha. Further reduction of density in the historic core is considered to be an important mission, however, because of the traffic congestion and the need to preserve the old city. Thus, the new plan is trying to encourage more people to move out toward the 4th ring road and suburban areas. The goal of reducing density in the historic core and between the 2nd and 4th ring roads does not match the city’s public transportation strategy, however. The traffic congestion and environmental problems in the built-up areas are not directly caused by density, but rather by existing transportation policies and systems, the lack of urban green spaces and the proliferation of urban super-blocks.
A New Polycentric Pattern: The old planned polycentric pattern failed to control urban growth from spreading out of the existing built-up center. After reviewing the reasons for this failure, several major principles can help to define a new spatial pattern: consider regional development and reinforce the physical links with the port city of Tianjin; define the area on a large scale with more attention to environmental protection; bring the market factors that affect urban structure into the planning process; and discard the former goal of creating equally sized satellite towns. The general concepts of the new polycentric pattern are to
Future Planning Practices
Developing a long-term urban plan is an enormous challenge for a city like Beijing, which is undergoing rapid urban development, growth and transformation with a very uncertain future. Several crucial questions regarding urban scale, density, spatial expansion and growth policies need further study and analysis.
Forecasting and controlling urban scale through planning is difficult for all urban planners and policy makers. Existing and potential natural resources serve to constrain future growth, and population is more controlled now by the market economy than by centrally planned policies of the past. Politically and economically, Beijing will continue to attract more investment, which needs more professionals, technicians and skilled workers, while it also has to deal with the pressure of unskilled migrants from rural areas. The limited amount of natural resources thus becomes a major element in planning, but it cannot be the only factor to help forecast the future scale of the city. Analysis of the full range of alternatives and their relevant policies should be prepared to address the most rapid and largest growth scenario imaginable.
A polycentric spatial structure might be a good solution for Beijing, but it needs more attention to the interdependencies of the central city and the new town centers. The old satellite town pattern failed because it focused on the development balance between existing local jurisdictions but neglected economic forces, physical relationships and environmental constraints on a regional scale. Several important elements help to define the new spatial pattern: the boundaries of the central urbanized area; the scale and location of the new town centers; and the relationships among these centers, Beijing, Tianjin and other mega-centers in the region. The efficient, rapid public transportation corridors between the city center and the sub-centers also are a critical element in making the polycentric model workable.
The fundamental purpose for launching the spatial development strategy study and updating the comprehensive planning process is to develop better policies to manage urban growth and balance land development and conservation with a long-term perspective. To reach that goal and to implement the new strategy will require legal tools and strong, comprehensive policies—a challenge for most Chinese cities under the existing policy-making system.
Preserving historic areas, agricultural land and environmentally sensitive areas is not compatible with the current hot economy and planned development. Preservation has never received much public funding support, a major reason for failed efforts in the past. The public sector now has sufficient resources and enough authority to balance development and preservation, but it needs to broaden the use of technical tools and incorporate more regional policies. Planning cannot be implemented only through planning regulations; it requires various authorities and professionals to work together on policies and programs that address planning, taxation, land use, environmental concerns and historic preservation.
The next five to 10 years will be a key period for the City of Beijing to create its new urban form. Local planners and decision makers should make a serious review of the last century of urban development history in U.S. cities. They have lessons to offer on both policy making and implementation regarding highways, suburbanization, shopping malls, the city beautiful movement and other urban issues. Current initiatives also are instructive: smart growth, regional growth control and management, mixed-use planning, density and design review. Globalization will bring more political and economic competition to the world’s largest cities, and Beijing must learn from past experiences and adapt to the new economic realities.
Yan Huang is deputy director of the Beijing Municipal Planning Commission. She was a visiting fellow at the Lincoln Institute and a Loeb Fellow at Harvard University Graduate School of Design in 2003–2004.
Una versión más actualizada de este artículo está disponible como parte del capítulo 5 del libro Perspectivas urbanas: Temas críticos en políticas de suelo de América Latina.
Como parte de las actividades educativas del Programa para América Latina del Instituto Lincoln, en junio pasado se dictó el curso Large-Scale Urban Redevelopment Projects [Grandes Proyectos Urbanos], el cual se centraba en los aspectos más importantes y desafiantes de este tema de planificación territorial. Académicos, funcionarios públicos y representantes de empresas privadas de 17 países participaron en las presentaciones y las discusiones. Este artículo presenta una síntesis de los principales temas, preguntas y retos planteados durante la ejecución de estos complejos proyectos.
Los macroproyectos de renovación urbana han pasado a ser materia importante en muchas naciones de América Latina en los últimos tiempos, debido en parte a los cambios propiciados por los procesos de globalización, la desregulación y la introducción de nuevos enfoques en la planificación urbana. Estos proyectos comprenden numerosos tipos de intervenciones, pero se caracterizan primordialmente por su gran magnitud en tamaño y escala, lo que plantea un reto para los instrumentos tradicionales de gestión y financiamiento urbanos.
Los proyectos urbanos de gran escala no se consideran una novedad en América Latina. Entre los diversos elementos de los proyectos de desarrollo encontramos la renovación de cascos históricos; la conversión de parques industriales abandonados, áreas militares, aeropuertos o estaciones ferroviarias; grandes proyectos de rehabilitación de viviendas marginales; y construcción de modelos novedosos de transporte público. No obstante, por lo menos cuatro rasgos fundamentales caracterizan este nuevo tipo de intervención:
La última característica se reafirma con la influencia de diferentes estrategias de planificación y los efectos de grandes proyectos urbanos en varias ciudades de todo el mundo (Powell 2000). Un proyecto que ha ejercido influencia en muchos planificadores y funcionarios públicos de ciudades latinoamericanas fue la transformación de Barcelona en preparación para los Juegos Olímpicos de 1992 (Borja 1995). Varios proyectos en América Latina se han inspirado en este enfoque, y en algunos casos lo han emulado directamente (Carmona y Burgess 2001), pero también ha enfrentado duras críticas (Arantes, Vainer y Maricato 2000). Se ha visto cómo un proceso de conveniencia a través del cual un grupo con poder de decisión o actores con intereses privados logran eludir la planificación oficial y las normativas existentes que se consideran como muy dependientes del debate (democrático) público. Como resultado, en su mayoría estos proyectos tienden a ser elitistas, porque desplazan los vecindarios de bajos ingresos mediante un uso regenerado y segregado del suelo para la clase media, o provocan exclusión social, porque los proyectos apuntan hacia una sola clase social, ya sea asentamientos de bajos ingresos o enclaves de altos ingresos, en zonas periféricas.
Los proyectos a gran escala plantean nuevas inquietudes, hacen más manifiestas las contradicciones inherentes y emplazan a los responsables del análisis del suelo urbano y la formulación de políticas. Son de particular importancia las nuevas formas de gestión, regulación, financiamiento y tributación que se requieren para la ejecución de estos proyectos, o que son resultado de éstos, y en general las consecuencias para el funcionamiento de los mercados del suelo.
Magnitud, escala y cronograma de ejecución
La primera cuestión que surge de la discusión de proyectos a gran escala tiene que ver con la ambigüedad del término y la necesidad de definir su validez. La magnitud es una dimensión cuantitativa, pero la escala sugiere interrelaciones complejas que conllevan efectos socioeconómicos y políticos. La vasta variedad de sentimientos evocados por los macroproyectos indica las limitaciones que existen para lograr reestablecer una visión del conjunto urbano y al mismo tiempo su carácter global (Ingallina 2001). Esta cuestión apenas comienza a discutirse en América Latina, y se enmarca en la transición hacia un nuevo enfoque en la planificación urbana, que está vinculado a la posibilidad e incluso la necesidad de construir una tipología e indicadores para su análisis. Forman parte de las discusiones cuestiones como el carácter emblemático de estos proyectos, su papel en la estimulación de otros procesos urbanos, la participación de muchos actores y la importancia de los efectos sobre la vida y el desarrollo de la ciudad. No obstante, el núcleo central de este tema es la escala, entendida como un concepto que abarca más que simples dimensiones físicas.
Puesto que la escala de estos proyectos se asocia con procesos urbanos complejos que conjugan continuidad y cambios a mediano y largo plazo, debe elaborarse el cronograma de ejecución de manera apropiada. Muchas de las fallas en la implementación de dichos proyectos se deben a la falta de una autoridad gestora que esté desligada o protegida de la volatilidad política de los administradores locales con el transcurso del tiempo.
Los casos de Puerto Madero en Buenos Aires y Fénix en Montevideo –el primero ya finalizado y el segundo todavía en marcha– sirven de ejemplos de las dificultades para controlar la escala y el momento de ejecución del proyecto de desarrollo en el contexto de situaciones y políticas económicas que pueden cambiar drásticamente. Doce años después de su construcción, Puerto Madero todavía no logra estimular otros macroproyectos, como la renovación de la cercana Avenida de Mayo, ni transformaciones tangibles en las normas urbanas.
La escala y el cronograma tienen importancia especial para el proyecto de Montevideo, puesto que surgen dudas acerca de la factibilidad de ejecución de un proyecto de esta escala en relación con el carácter de la ciudad, su economía y demás prioridades y políticas del país. Su objetivo era generar una “obra de impacto urbano”, en este caso la promoción de inversiones públicas, privadas y mixtas en un vecindario que perdió el 18,4% de su población entre 1985 y 1996, enfocándose en un edificio emblemático como la estación de trenes General Artigas. La obra ha sido terminada en su mayor parte, con un préstamo de $28 millones otorgado por el Banco Interamericano de Desarrollo; sin embargo, el porcentaje de inversiones públicas y privadas es mínimo y actualmente el proyecto Fénix tiene que competir con otro macroproyecto empresarial-comercial ubicado al este de la ciudad, el cual ya está despertando el interés de firmas y compañías importantes.
Aspectos de las políticas del suelo
La cuestión de la escala se relaciona intrínsecamente con la función del suelo urbano, por lo que cabe preguntarse si la tierra (incluido su valor, usos, tenencia y demás factores) debiera considerarse como una variable clave en el diseño y gestión de las operaciones urbanas a gran escala, dado que suele vincularse la factibilidad y éxito de estos proyectos con la absorción de elementos exógenos formidables a menudo reflejados en el costo y administración del suelo.
Los proyectos concebidos para restaurar cascos históricos ofrecen lecciones valiosas que debemos considerar. Podemos comparar los casos de La Habana Vieja, donde la propiedad de la tierra recae por completo en el Estado, el cual ha permitido ciertas actividades de expansión, y Lima, donde la tenencia de la tierra se divide entre muchos propietarios privados y entidades del sector público, lo que acentúa las dificultades para culminar el proyecto de restauración en marcha. Si bien La Habana Vieja ha recibido una importante cooperación financiera de Europa y Lima tiene un préstamo de $37 millones del Banco Interamericano de Desarrollo, el reto fundamental es promover la inversión privada y al mismo tiempo seguir ofreciendo a los residentes locales programas de asistencia social y económica. Ambas ciudades han creado unidades especiales para la gestión de estos proyectos, lo que constituye una perspectiva interesante sobre la modernización de las instituciones.
El papel del Estado
La escala, la dimensión temporal y el papel del suelo en proyectos urbanos grandes nos hacen considerar el papel del Estado y la inversión pública. Si bien las operaciones urbanas a gran escala no son un concepto nuevo en las ciudades latinoamericanas, sus condiciones actuales se han visto sumamente afectadas por los cambios económicos, las crisis políticas y las modificaciones sustanciales en el papel del Estado en general. Estas condiciones convierten la ejecución de los proyectos urbanos, como parte del proceso de desarrollo urbano a largo plazo, en un cúmulo de contradicciones con la permanencia usualmente corta de los gobiernos municipales y los límites de sus reclamos territoriales. Asimismo debemos considerar las diferencias en materia de competencias reguladoras entre los gobiernos centrales y las municipalidades locales y las diferencias entre entidades públicas e instituciones privadas u organizaciones comunitarias locales, lo que suele reflejar conflictos de interés debido a los procesos de descentralización y privatización que se están promoviendo simultáneamente en muchos países.
Dos proyectos grandes en el área de la infraestructura de transporte sirven de ejemplo para ilustrar situaciones locales que condujeron a resultados muy distintos. Uno de ellos fue la transformación del antiguo aeropuerto abandonado de Cerillos en Santiago de Chile y el otro era el proyecto de un nuevo aeropuerto para la Ciudad de México en Texcoco, un ejido ocupado por campesinos y sus descendientes. En el primer caso, la participación activa de grupos interesados está ampliando el proceso de recuperación de una zona de la ciudad que no cuenta con instalaciones urbanas de calidad. Una inversión total de $36 millones provenientes del sector público y $975 millones del sector privado sirve para financiar la construcción de centros comerciales, planteles educativos, centros de salud, instalaciones recreativas y viviendas para el vecindario. En el caso de México se han dado conflictos graves entre los intereses del Estado y los derechos de la comunidad sobre el suelo que han causado perturbación social y hasta el secuestro de funcionarios públicos. Como resultado, recientemente el gobierno federal ha decidido retirarse del proyecto Texcoco, decisión que le ha ocasionado un enorme costo político y económico.
Segregación y exclusión
Muchos planificadores y profesionales tienen dudas acerca de la factibilidad de los macroproyectos en países y ciudades pobres a causa de las distorsiones que pudiera causar su ejecución en el desarrollo futuro, en particular por el reforzamiento de las tendencias de segregación y exclusividad social. A las dudas que existen sobre su éxito se suma la disminución de la capacidad que tiene el Estado para hallar nuevas alternativas de financiamiento para proyectos de beneficios sociales a través de capitales privados, sobre todo los de origen internacional. Muchos macroproyectos son vistos como la única alternativa o el costo inevitable que tiene que pagar la ciudad o la sociedad para generar un ambiente atractivo en un contexto en el que las ciudades compiten cada vez más por un número reducido de inversionistas externos.
Un asunto clave con respecto al uso del espacio público generado por estos proyectos es evitar la segregación espacial y humana. Es indispensable prestar mucha atención para proteger a los habitantes de las zonas donde se desarrollan macroproyectos urbanos contra las consecuencias negativas de la regeneración urbana. Sin duda alguna éste es uno de los aspectos más difíciles de los proyectos urbanos grandes. La tabla 1 muestra los aspectos más importantes y los principales desafíos que surgen del análisis de este tipo de proyecto. De hecho, la integración de proyectos de este alcance requiere una visión de la ciudad que impida la creación de islas de modernidad apartadas en medio de áreas pobres, las cuales contribuirían al proceso llamado dualidad de la ciudad, o el surgimiento de nuevos centros urbanos exclusivos.
Tabla 1. Aspectos y retos de los macroproyectos urbanos
Para facilitarnos la reflexión sobre este asunto, mencionemos dos casos en contextos político-económicos diferentes. Uno es el proyecto Ciudadela El Recreo en Bogotá, planificado por MetroVivienda. Aunque presenta propuestas novedosas para el uso y gestión del suelo en un proyecto grande de viviendas populares, el proyecto no ha podido garantizar la integración de grupos sociales con diferentes niveles de ingresos. En el Corredor Sur de la ciudad de Panamá se está haciendo la planificación urbana de grandes zonas para la construcción de residencias, pero una vez más el resultado beneficia principalmente a los sectores de medianos y altos ingresos. De este modo, tanto en un país descentralizado como en uno centralizado, las normas generales que provocan la segregación residencial no parecen evitar las consecuencias negativas que afectan a los sectores más pobres de la sociedad.
En vista de todo esto, los grandes proyectos urbanos no deben verse como un enfoque alternativo para planes obsoletos o normas rígidas como la zonificación. Más bien, pueden presentarse como un tipo de planificación a escala intermedia, como un enfoque integrado que aborda las necesidades de la ciudad entera e impide las separaciones físicas y sociales y la creación de normas que permiten privilegios exclusivos. Sólo de esta manera podrán los proyectos a gran escala consagrarse como nuevos instrumentos de la planificación urbana. Los efectos positivos de elementos específicos, como la calidad de la arquitectura y del diseño urbano, tienen gran valor en estos proyectos si fungen como punto de referencia y se distribuyen con equidad en toda la ciudad.
Beneficios públicos
Los proyectos a gran escala son obras públicas por la naturaleza de su importancia y su impacto, pero esto no significa que sean de propiedad total del Estado. No obstante, la complejidad de las redes de participantes involucrados directa o indirectamente, la variedad de intereses y el sinnúmero de contradicciones inherentes a los macroproyectos hacen necesario que el sector público asuma el liderazgo de la gestión. La escala territorial de estas operaciones depende especialmente del respaldo de los gobiernos municipales, los que en América Latina suelen carecer de recursos técnicos para manejar proyectos de esta envergadura. El apoyo local puede garantizar una reducción de los elementos exógenos negativos y la incorporación de participantes más débiles –por lo general actores locales– a través de una distribución más justa de los beneficios, cuando la regulación del uso y la tributación del suelo es un elemento crítico. Esta es la intención que imprimió la Municipalidad de Santo André en São Paulo en el diseño del proyecto Eixo Tamanduatehy, de extraordinaria complejidad. Se trata de reutilizar una extensión enorme de terreno previamente ocupado por instalaciones ferroviarias y plantas industriales vecinas, las cuales abandonaron esta área –que alguna vez fuera un dinámico parque industrial de São Paulo– para reubicarse en el interior del país. El proyecto propone la creación de un lugar viable para nuevas actividades, en su mayoría servicios e industrias de alta tecnología, con capacidad para sustituir la base económica de esa región.
Más allá de crear y promocionar la imagen del proyecto, es importante lograr legitimidad social mediante la combinación de socios públicos y privados aliados en empresas mixtas, la venta o arrendamiento de suelo urbano, la compensación por inversión privada directa, la regulación y hasta la recuperación (o recaptura) pública de los costos y los incrementos inmerecidos del valor del suelo. También es necesaria una gestión pública activa, ya que el desarrollo de la ciudad supone propiedades y beneficios comunes, no sólo intereses económicos. Igualmente es fundamental el análisis de los costos económicos y financieros, así como los costos de oportunidad, para evitar el fracaso de estos proyectos.
Conclusiones
Los componentes básicos en la etapa preoperativa de la ejecución de macroproyectos urbanos pueden resumirse de la siguiente manera:
Es indispensable hacer un análisis adecuado de las compensaciones recíprocas (económicas, políticas, sociales, ambientales y demás), incluso si está claro que los problemas complejos de la ciudad contemporánea no pueden resolverse con grandes intervenciones solamente. Es elemental recalcar que debe atribuírsele mayor importancia a la institucionalización y legitimidad de los planes y acuerdos finales que a la simple aplicación de normas jurídicas.
Las presentaciones y discusiones del curso Large Urban Projects demuestran que la cuestión del suelo urbano sin duda subyace en todos los aspectos y retos descritos anteriormente. El suelo en este tipo de proyectos presenta gran complejidad y ofrece una oportunidad magnífica; el reto está en la manera de navegar entre los intereses y conflictos cuando el suelo tiene muchos propietarios y partes interesadas. Es necesario vencer la tentación de creer que la planificación urbana moderna es la suma de grandes proyectos. Sin embargo, estos proyectos pueden contribuir a crear una imagen compartida de la ciudad entre sus habitantes y sus usuarios. Este tema indudablemente posee facetas que no se han terminado de explorar y que necesitan un análisis continuo de colaboración por parte de académicos, autoridades gobernantes y ciudadanos.
Mario Lungo es director ejecutivo de la Oficina de Planificación del Área Metropolitana de San Salvador (OPAMSS) en El Salvador. Además es profesor e investigador de la Universidad Centroamericana José Simeón Cañas.
Referencias
Borja, Jordi. 1995. Un modelo de transformación urbana. Quito, Peru: Programa de Gestion Urbana.
Carmona, Marisa y Rod Burgess. 2001. Strategic Planning and Urban Projects. Delft: Delft University Press.
Ingallina, Patrizia. 2001. Le Projet Urbain. Paris: Presses Universitaires de France.
Powell, Kenneth. 2000. La transformación de la ciudad. Barcelona: Ediciones Blume.
Arantes, Otilia, Carlos Vainer y Erminia Maricato. 2000. A cidade do pensamento unico. Petrópolis: Editora Vozes.
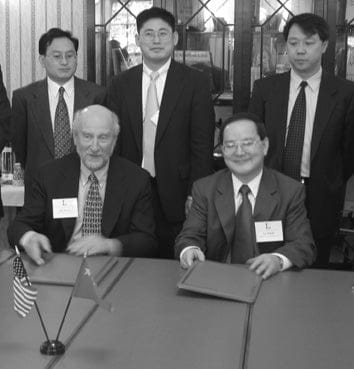
Photograph Caption: H. James Brown, president of the Lincoln Institute, with Lu Xinshe, vice-minister of China’s Ministry of Land and Resources, signed an agreement in September 2002 at Lincoln House. Observing the occasion are (left to right) Yang Yixin, deputy director general of the Ministry, Chengri Ding, and Wang Guanghua, director general of the Ministry’s Information Center.
Driving around a bustling Chinese city, one can almost feel the pace of change. Just a few decades ago, China was a sleeping giant whose prominence in world affairs seemed forever relegated to its ancient past. Today China boasts one of the world’s fastest growing economies and some of the most vibrant cities, and it is among the most active and interesting real estate markets.
From 1978 to 1997, gross domestic product in China grew at a remarkable 17 percent annual rate. Over the last several years, while most Western nations languished in recession, the economy of China grew at a steady 7 to 8 percent. China’s population continues to grow as well. In November 2000, China’s population was approximately 1.3 billion; by the year 2050 it is expected to reach 1.6 billion. Following familiar international patterns, the combination of population growth and economic expansion is manifest most prominently in Chinese cities. From 1957 to 1995, China’s urban population grew from 106 to 347 million. In 1982 there were 182 Chinese cities; by 1996 there were 666.
While urbanization has led to significant improvements in the welfare of the Chinese people, it has also placed enormous pressure on China’s land resources. China is the world’s third largest country in land area (after Russia and Canada). But, with more than 21 percent of the world’s population living on about 7 percent of the world’s cultivated land, China’s farmland resources are relatively scarce. Between 1978 and 1995 China’s cultivated land fell from 99.4 million to 94.9 million hectares while its population rose from 962 million to 1.2 billion. Simply because of its scale, the widening gap between China’s growing population and a shrinking supply of farmland has implications not only for China’s ability to feed itself, but also for global food security.
To manage its land base and rapid urban expansion, the Chinese government in the early 1980s launched sweeping reforms of the structure of institutions that govern land and housing allocation. While maintaining the fundamental features of a socialist society (state or collective ownership of land), China has moved toward a system in which market forces shape the process of urbanization and individuals have greater choice over where to work and live. Among the most influential of these changes are the establishment of land use rights, the commercialization of housing, and a restructuring of the urban development process.
Land Use Rights
Before the People’s Republic of China (PRC) was founded in 1949, land could be privately owned and legally transferred through mutual agreement, and property taxes were a key source of local public finance. Soon after the Communist Revolution, however, property use rights were radically transformed. In rural areas the Communist Party confiscated all privately held land and turned it over to the poor. Later, peasants joined communes (“production co-operations”) by donating their assets, including their land. Today, nearly all land in rural areas remains owned by farmer collectives. In urban areas, the Communist Party took a more gradual approach. While confiscating property owned by foreign capitalists and anti-revolutionaries, it allowed private ownership and land transactions to continue. Over the next two decades, however, through land confiscation, strict controls on rent and major investments in public housing, state dominance in urban land and housing markets grew. By the end of the Cultural Revolution in 1976, nearly all land was owned by collectives or by the state. Private property rights virtually disappeared and land transactions were banned.
Modern land reforms began in the mid-1980s. Following a successful experiment in Shenzhen (a Special Economic Development Zone on the border with Hong Kong), in which state-owned land was leased to foreign corporations, the Constitution was amended in 1988 so that “land use can be transacted according to the law.” In 1990, China officially adopted land leasing as the basis for assigning land use rights to urban land users.
In the current property rights regime, use rights for specified periods (e.g., 40 to 70 years) can be obtained from the state through the up-front payment of land use fees. The fees are determined by the location, type and density of the proposed development. This separation of land ownership and use rights allows the trading of land use rights while maintaining state ownership of land. For the Chinese government, this separation offered three advantages: first, market mechanisms could help guide the allocation of land resources; second, land use fees would provide local government with a new source of revenues; and third, by retaining state ownership, social and political conflict would be minimized.
In the short period following its adoption, the new system of land use rights has had profound symbolic and measurable impacts. By embracing the concept of property rights, the system provided Chinese residents and firms with greater economic freedom and signaled to the world that China welcomes foreign investment on Chinese soil. By establishing legal rights of use, China has promoted the development of land markets, enhanced the fiscal capacity of local governments, and accelerated the advancement of market socialism. The system also created a fast-growing real estate market that is now transforming China’s urban landscape.
Despite its advantages, the system created many new challenges. First, state-owned enterprises can still acquire land through administrative channels, causing price distortions and large losses of local government revenues. Second, government officials are tempted to lease as much land as possible for their own short-term gain. Since revenues from the sale of land use rights account for 25 to 75 percent of some local government budgets, future losses of revenue are inevitable as land becomes increasingly scarce. Third, there is great uncertainty about what happens when existing leases expire. Most leases stipulate, for example, that without payments for renewal, rights of use return to the state. However, it will be extremely difficult to collect such payments when hundreds or thousands of tenants share rights previously purchased by a single developer. Finally, the government lacks the ability to capture its share of rents as they increase over time. As capital investments and location premiums rise, these losses could be substantial.
Whether land use rights and the markets they create will soon dominate the process of urban development or alter the structure of Chinese cities also remains uncertain. There is evidence that land use fees vary spatially in Chinese cities, much like prices and rents in Western cities. But it may be several decades before skylines and capital-land ratios in Chinese cities mirror those in the West. Further, fees remain set by administrative rather than competitive processes. Thus, the extent to which they will improve the allocation of land resources remains to be seen.
The Commercialization of Housing
The socialization of housing was an important element of the communist transformation. But because the communist party took a more gradual approach in urban areas, private ownership remained the dominant form of housing tenure in Chinese cities through the mid-1950s. Over the next two decades little private housing was constructed because the state owned all the land, imposed strict ceilings on rents, and generally discouraged speculative building. By the end of the Cultural Revolution in 1976, privately owned housing had virtually disappeared.
In the absence of private housing markets, shelter became part of the social wage provided by the state. Housing was not provided directly by the government but through the work unit or danwei, a state-owned enterprise that serves as a vehicle for structuring economic activity and social organization. The main defining feature of a danwei is its multi-functionality as a place of employment, residence, education and commerce. A danwei worker acquires housing “according to his work,” a fundamental socialist allocation principle. In this system the allocation of housing is determined by social status and length of employment, not prices and incomes.
Danwei housing was an integral element of a centrally planned economy in which financial resources were planned by entire sectors (industrial, educational, health care, and others). Housing was merely one element of these larger development projects and was constructed only if the project needed workers and those workers needed housing. Investments in housing and other services such as schools (if the project was large), canteens and daily-use grocery stores were made in conjunction with the overall project; entire communities were thus built all at once enabling workers to live close to their work. The distinctive role of the danwei has had a profound impact on the morphology of Chinese cities and has complicated housing policy reforms ever since.
While serving to promote socialist ideology and minimizing popular unrest, the danwei system had serious limitations. The combination of negligible rents and excessive housing demand placed heavy financial and production burdens on the state. Housing allocations were based on criteria such as occupation, administrative rank, job performance, loyalty and political connections. Gross inequities were common. Finally, inadequate revenue generation from rents diminished the quality of housing management and maintenance and discouraged the construction of private rental housing or owner-occupied housing by private developers.
When Deng XiaoPing came into power in 1978, he attacked the state-controlled public housing system and introduced market forces into the housing policy arena. Subsequently, the government initiated a reform program with privatization as a major component. The privatization of the state-controlled housing sector included several elements: (1) increases in rents to market levels; (2) sales of public housing to private individuals; (3) encouragement of private and foreign investments in housing; (4) less construction of new public housing; (5) encouragement and protection of private home ownership; (6) construction of commercial housing by profit-making developers; and (7) promotion of self-build housing in cities.
The dismantling of the danwei housing system and the commodification of housing, though far from complete, has produced rapid growth in the housing industry and a substantial expansion of the housing stock. By 1992, the government share of investments in housing had fallen to 10 percent—less than the share of investment from foreign sources. In the wake of an extended housing boom, per capita living space rose from 4.2 square meters in 1978 to 7.9 in 1995.
Growing pains persist, however. Many Chinese still live in housing deemed inadequate by Western standards, and critical financial institutions remain underdeveloped. Housing for the wealthy is overabundant while housing for the poor remains scarce. Further, as space per Chinese resident rises, maintaining jobs-housing balance becomes increasingly difficult. The replacement of danwei housing with a Western-style housing market gives Chinese residents greater freedom of location, but it may lead to the deconstruction of communities in which work, leisure and commerce are closely integrated. Rising automobile ownership also may create Western-style gridlock. Furthermore, the rapid rise of commercial housing undermines the longstanding tradition in which access to affordable housing is an integral part of the social contract. As a result, the commercialization of housing, far more than a mere change in ownership structure, represents a fundamental change in the core institutions of Chinese society.
Restructuring Urban Development
Unlike many other rapidly developing nations, China is still relatively nonurbanized. In 2000, approximately 36 percent of China’s population lived in urban areas, and no single metropolitan area dominated the urban hierarchy. Among the many reasons for this pattern is the government’s regulation of rural-urban migration through a household registration system, or hukou. Every Chinese resident has a hukou designation as an urban or rural resident. Hukou is an important indicator of social status, and urban (chengshi) status is necessary for access to urban welfare benefits, such as schools, health care or subsidized agricultural goods. Without urban hukou status it is very difficult to live in cities. By limiting access to the benefits of urbanization, the hukou system ostensibly served as the world’s most influential urban growth management instrument.
As land and housing markets have emerged, the hukou system has weakened. Rural peasants now account for a significant portion of the urban population. As a result, China has been forced to manage urban growth, like other nations, through the conversion of land from rural to urban uses. Today, this can occur in one of two ways: (1) work units and municipalities develop land acquired from rural collectives through an administrative process; and (2) municipalities acquire land from rural collectives and lease it to developers. While providing local governments with new sources of revenues and introducing market rationality, this dual land market has introduced other complexities in the urban development process. Black markets have been created, for example, by the difference in price between land obtained virtually free through an administrative process and land leased to the private sector upon payment of fees. Work units have undertaken developments incompatible with municipal plans. And, urban sprawl has arisen in the special development zones that have proliferated in the rush to attract foreign investment.
To address these problems, the 1999 New Land Administration Law (which amended the 1988 Land Administration Law) was adopted to protect farmland, manage urban growth, promote market development, and encourage citizen involvement in the legislative process. Besides strengthening property rights, the law mandates no net loss of cultivated land. It stipulates that “overall plans and annual plans for land utilization take measures to ensure that the total amount of cultivated land within their administrative areas remains unreduced.” This means that land development cannot take place on farmland unless the same amount of agricultural land is reclaimed elsewhere. As reclaimable land is depleted, urban land supplies will diminish, the cost of land reclamation will rise and ultimately that cost will be passed on to consumers. Since its implementation, the law has drawn widespread criticism for stressing farmland protection over urban development. Due to rising incomes and larger populations, the demand for urban land will continue to increase. Given the fixed amount of land, development costs will certainly rise and gradually slow the pace of urban development.
Challenges and Opportunities
For those interested in land and housing policy, China is difficult to ignore. Through perhaps the most sweeping and nonviolent land and housing reforms the world has ever seen, China is moving from a system tightly controlled by the state to one strongly influenced by market forces. The pace at which this transformation is taking place offers rare challenges and opportunities. For land policy researchers, China offers opportunities to explore questions central to international urban policy debates: (1) how do market forces shape the internal structure of cities? (2) can markets provide safe and affordable housing for all segments of the population? and (3) are markets the primary cause of urban sprawl? For academics and practitioners involved in education and training, China offers the challenge of sharing the lessons of Western experience without encouraging the Chinese to make the same mistakes. In the process, both researchers and trainers have the opportunity to improve the process of development in the world’s most rapidly urbanizing nation.
Chengri Ding is assistant professor in the Department of Landscape Architecture and Urban Planning at Texas A&M University in College Station, Texas. He also serves as special assistant to the president of the Lincoln Institute for the China Program.
Gerrit Knaap is professor and director of the National Center for Smart Growth at the University of Maryland. The authors are editing a Lincoln Institute book on land and housing markets in China, including papers presented at the First World Planning Schools Congress held in Shanghai in July 2001.
Governments have long recognized the need to preserve certain open space lands because of their importance in producing public goods and services such as food, fiber, recreation and natural hazard mitigation, or because they possess important geological or biological features.
New impetus for open space preservation results from the desire to counteract the effects of declining urban cores, suburban sprawl, and the socioeconomic and land use changes now encroaching on high-amenity rural areas. The growing use of habitat conservation plans for reconciling environmental and economic objectives also draws attention to the values of open space, especially in comparison to alternative land uses.
It is likely that most decisions about open space preservation will be made at the local level, due in part to the general trend of devolution of governmental responsibility (with accompanying fiscal responsibility), as well as an increase in the institutional capacity and activism of local land conservation trusts. Since local governments are heavily dependent on the property tax for operating revenue, the fiscal and economic implications of open space preservation decisions are paramount. Conservationists are frequently called upon to demonstrate to local communities the economic value of preserving open space.
While much has been written about the economic value of the environment in general and of open space in particular, the literature is segregated by discipline or methodology. It is therefore difficult to assess the economic value of open space comprehensively. It is even more difficult to apply what is known in a public policy context, where open space holds significant non-monetary value.
Concepts of Value and Public Goods
Like all natural ecosystems, open space provides a variety of functions that satisfy human needs. However, attempting to assign monetary values to these functions presents several challenges. First, open space typically provides several functions simultaneously. Second, different types of value are measured by different methodologies and expressed in different units. Converting to a standard unit (such as dollars) involves subjective judgments and is not always feasible. Third, values are often not additive, and “double counting” is an ever-present problem. Finally, some would argue that it is morally wrong to try to value something that is by definition invaluable. At a minimum, they say, open space will always possess intangible values that are above and beyond any calculation of monetary values.
Open space often plays an important role in the provision of “public goods.” Public goods are nonexcludable: once they are produced it is impossible or very costly to exclude anyone from using them. They are also nonconsumptive: one person’s enjoyment of the good does not diminish its availability for others. The limited ability of producers to exclude potential users typically precludes the development of market allocation systems for public goods. As a result, easily observed measures of value, like those expressed through market prices, do not exist. Yet land use and resource management decisions imply tradeoffs between marketed and non-marketed goods and services, making it difficult to compare relative values and, through tradeoffs, arrive at socially optimal decisions.
Use and Nonuse Values
Much of the economic value associated with open space activities like recreation can be examined as use value and nonuse value. Use value results from current use of the resource, including consumptive uses (i.e., hunting and fishing), nonconsumptive uses (i.e., hiking, camping, boating and nature photography) and indirect uses (i.e., reading books or watching televised programs about wildlife).
Activities directly or indirectly associated with open space may provide an important source of revenue for businesses and state and local governments. For example, hunting and fishing license fees are a major source of funding for state wildlife agencies. Less direct but perhaps more important from an overall economic perspective are expenditures related to nonconsumptive open space activities that also have income and job multiplier effects and often occur in rural areas with limited commercial potential.
The economic implications of use and nonuse values across society can be very large, and many economists agree that these values should be considered in open space decisionmaking. Measuring use and nonuse values is difficult, however, due to the lack of markets and market prices and the existence of administratively set, quasi-market prices such as hunting and fishing license fees. To arrive at socially meaningful estimates of value for many nonmarket resources, economists use the concept of consumer surplus, or the amount above actual market price that a buyer would theoretically be willing to pay to enjoy a good or service.
Two methods are used to first estimate the demand curve for the resource: contingent valuation or travel cost methods. In the first, a hypothetical market is created in a survey and respondents are asked what they would be willing to pay for some defined activity or resource. In the second, the cost of travel to a site is viewed as an entry or admission price, and a demand curve is derived from observing visitation from various origins with different travel costs. While still controversial, these methods have been used in numerous studies to estimate the willingness to pay in addition to actual expenses for various recreational activities ( see chart 1), as well as for nonuse values such as maintaining populations of certain endangered species or preserving unique bird habitats.
Several types of nonuse values consider the possibility for future use. Option value represents an individual’s willingness to pay to maintain the option of utilizing a resource in the future. Existence value represents an individual’s willingness to pay to ensure that some resource exists, which may be motivated by the desire to bequest the resource to future generations.
Measuring the Economic Value of Open Space
As a result of decreased intergovernmental transfers of financial aid and increasing citizen resistance to taxes, local officials now scrutinize the fiscal consequences of land use decisions more than ever before. The primary analytic tool available to policymakers for this purpose is fiscal impact analysis, a formal comparison of the public costs and revenues associated with growth within a particular local governmental unit. Fiscal impact analysis is utilized frequently in large communities experiencing growth pressures on the metropolitan fringe, and it is being applied to open space preservation.
A review of fiscal impact studies by Robert Burchell and David Listokin concludes that generally residential development does not pay its own way. They found that nonresidential development does pay for itself, but is a magnet for residential development, and that open space falls at the break-even point. A study of eleven towns by the Southern New England Forest Consortium shows that on a strictly financial basis the cost of providing public services is more than twice as high for residential development as for commercial development or open space. (see chart 2)
Care must be taken when evaluating the results of fiscal impact analyses for several reasons: the choices of methodology and assumptions greatly influence the findings; specific circumstances vary quite widely from community to community; and fiscal impact analyses do not address secondary or long-term impacts. Nevertheless, fiscal impact analysis is a powerful and increasingly sophisticated planning tool for making decisions about land use alternatives at the community level.
The most direct measure of the economic value of open space is its real estate market value: the cash price that an informed and willing buyer pays an informed and willing seller in an open and competitive market. In rural areas, where highest and best use of land (i.e., most profitable use) is as open space, one can examine market transactions. In urban or urbanizing regions, however, where highest and best use (as determined by the market) has usually been development, the open space value of land must be separated from its development value, especially when land is placed under a conservation easement.
Open space may also affect the surrounding land market, creating an enhancement value. Casual observers find evidence of enhancement value in real estate advertisements that feature proximity to open space amenities, and it is explicitly recognized by federal income tax law governing the valuation of conservation easements. A number of empirical studies have shown that proximity to preserved open space enhances property values, particularly if the open space is not intensively developed for recreation purposes and if it is carefully integrated with the neighborhood. Enhancement value is important to the local property tax base because it offsets the effects of open space, which is usually tax-exempt or taxed at a low rate.
Open space possesses natural system value when it provides direct benefits to human society through such processes as ground water storage, climate moderation, flood control, storm damage prevention, and air and water pollution abatement. It is possible to assign a monetary value to such benefits by calculating the cost of the damages that would result if the benefits were not provided, or if public expenditures were required to build infrastructure to replace the functions of the natural systems.
An example of this approach is the Charles River Basin in Massachusetts, where 8,500 acres of wetlands were acquired and preserved as a natural valley storage area for flood control for a cost of $10 million. An alternative proposal to construct dams and levees to accomplish the same goal would have cost $100 million. In another study, the Minnesota Department of Natural Resources calculated that the cost of replacing the natural floodwater storage function of wetlands would be $300 per acre foot.
Lands valued for open space are seldom idle, but rather are part of a working landscape vital to the production of goods and services that are valued and exchanged in markets. Often, the production value resulting from these lands is direct and readily measured, as is the case in crops from farms and orchards, animal products from pasture and grazing lands, and wood products from forests. The economic returns from production accrue directly to the landowner and often determine current and future land use alternatives.
Open space lands may also play a less direct but nonetheless important production role for market-valued goods that depend in part on functions provided by private lands. Examples are the role of privately owned wetlands in fish and shellfish production and the role of private lands in supplying habitat for wild game. In addition to providing market-valued goods and services, direct and indirect production from open space lands supports jobs that are valuable to local, regional and national economies.
Conclusions
It will never be possible to calculate completely the economic value of open space, nor should it be. Certain intangible values lose significance when attempts are made to quantify them. Indeed, to incorporate into the real estate market the public values of open space without also developing a means of capturing those values for the public benefit would be counterproductive for conservation purposes.
Land use decisions ranging from the allocation of scarce conservation budgets to the property rights debate will be better informed if there is a more comprehensive understanding of the economic value of open space. Methods for determining and comparing value vary widely in level of sophistication and reliability. Some are based on long-established professional standards, while others continue to evolve. Given the inherent subjectivity of the term, any discussion of value must include a variety of disciplines, methodologies and approaches. The greatest benefit may be in prompting reassessment of the “conventional wisdom” about the economic consequences of development and conservation.
Charles J. Fausold is a fellow at the Lincoln Institute of Land Policy. Robert J. Lilieholm is an associate professor at Utah State University and a former visiting fellow at the Lincoln Institute. With partial support from the Boston Foundation Fund for the Preservation of Wildlife and Natural Areas they are reviewing and synthesizing existing information to develop a useful framework for considering the economic value of open space.
The conversion of land from agricultural production to urban and industrial development is one of the critical processes of change in developing economies undergoing industrialization, urbanization, and globalization. Urban land use changes taking place in China have attracted much scholarly attention, especially in light of the extensive economic reforms, remarkable economic growth, and profound structural changes over the last three decades. The transition from a planned to a market economy and from authoritarian to more decentralized provincial and local government has generated a new institutional setting for changes in land use (Lin and Ho 2005).
The prevailing view is to characterize land use change as the outcome of economic growth and structural change. This argument aligns itself with the neoclassical growth model in which land plays a decreasing role in economic growth. However, these changes in land use can be both the consequence of economic growth and the drivers of such growth (Bai, Chen, and Shi 2011; Ding and Lichtenberg 2011).
The reality is much more complicated. Instead of being driven by growing population, urban land expansion in China is motivated by land finance, whereby local governments raise revenue and attract investment by leasing and developing land. As a result, land-centered urban policy has been identified as one of the most important driving forces operating behind the spectacular expansion of cities since the mid-1990s (Lin 2007). Supplying agricultural land for nonagricultural purposes effectively allows the local government to “kill many birds with one stone” (Ping 2011). As a result, land development fuels economic growth, especially in urbanized areas.
Land use changes in China are also affected in significant ways by land supply policies, which have been adjusted regularly to meet the demands of economic development. Illegal land supply is a leading cause of excessive and uncontrolled investment, which occurs when local governments do not supply land to land users according to current land use plans or following the final permission of the central government. As a result, the central government started to use land policy as a major aspect of national macro-economic control in late 2003.
Among other measures, land transfers have been conducted through auction or tender since 2004, and land supply policy has shifted from quantity control to structural control since 2006. Land use indexes distributed by the central government to the local governments emphasized only the quantity of land before 2006, but currently the distribution of land uses among categories is set by the central government and even the intensity of land use is defined.
This legacy can be seen in the State Council’s establishment of the highly centralized State Land Supervision (SLS) system in 2006. Nine new regional offices were charged with investigating illegal land supply across the country (Tao et al. 2010). The new land policy has played an active role in improving land use by forbidding land to be leased to projects inconsistent with national industrial policy, development plans, and entry standards. Following the introduction of these reforms, the amount of land supplied illegally has decreased greatly due to stringent control, while GDP generated per unit of developable land has increased substantially (China Land and Mine Resources Law Center 2007). It is expected that this stringent land policy will have a significant impact on the spatial pattern of land use and may affect the association between land use changes and economic growth in China.
Changes in Land Use Patterns Across China
Land policy in China has changed dramatically since 2004, and one would also expect a different pattern of land use since then. Based on official county-level data from 2004 and 2008, we examine land use change at the provincial prefecture city level and explore the spatial relationship between land use change and economic growth. Official land use change data are divided into several land use categories at three levels every year. The first level includes agricultural land, construction land, and unused land; the second level contains ten categories of land uses; and the third level contains 52 subcategories.
Table 1 shows land use changes nationally from 2004 to 2008, during which time more land was converted into uses for construction while the amount of agricultural land and unused land declined. Among agricultural land categories, pasture land and cultivated land shrank by 12.69 million mu (0.85 million hectares) and 11.27 million mu (0.75 million hectares) respectively. Unused land fell by 17.91 million mu (1.19 million hectares).
Given recent rapid industrialization and urbanization, it is not surprising that the fastest land conversions in China have been to construction uses, which added 18.83 million mu (1.26 million hectares). In the category of settlements and industrial/mining sites, cities, designated towns, and industrial/mining sites witnessed the fastest land expansion, with growth rates of 19.61, 13.33, and 12.42 percent respectively, while the land area of rural settlements decreased. Significant amounts of land were also converted for the use of transportation, particularly the construction of highways.
This national-level analysis hides many spatial variations in land use changes in particular provinces and regions (figure 1). Thus we explore land use changes at the provincial level, focusing on the changes to cultivated land, urban land (including cities and designated towns), stand-alone industrial/mining sites, rural settlements, and transportation land for highways.
Figure 2 shows that losses of cultivated land occurred mainly in eastern and central China. Economic growth, urbanization, and industrialization have accelerated in Hebei, Jiangsu, Zhejiang, Guangdong, and Guangxi provinces, where the most cultivated land was converted to urban, industrial, and transportation purposes. Shanxi, Shaanxi, Chongqing, and Sichuan provinces also saw rapid conversion of cultivated land to nonagricultural activities. Those provinces are located in China’s transitional geographic belt, where cultivated land is the best choice for construction and development. In contrast, inland provinces including Tibet, Qinghai, Xinjiang, Inner Mongolia, and Heilongjiang saw some increases in cultivated land.
Land for rural settlements is influenced by both new countryside policies and rural income growth. Increases in income have influenced the conversion of land to rural settlements in the eastern provinces such as Guangdong, Fujian, Zhejiang, Guangxi, Hebei, and Tianjin, and in some inland provinces including Heilongjiang, Inner Mongolia, Xinjiang, Qinghai, Tibet, Yunnan, Guizhou, Hubei, and Shanxi. However, some provinces experienced significant decreases in land used for rural settlements, particularly in Jiangsu, Jiangxi, and Anhui. This decline may be associated with new countryside policies, which have actually forced farmers into towns.
Urbanization and industrialization are the major drivers of nonagricultural land expansion in China. The urbanization rate grew from 40.50 to 45.68 percent between 2004 and 2008, when all provinces experienced urban and industrial land expansion (figure 3). However, most urban land expansion occurred south of the Yangtze River. In the north, only Shandong, Anhui, and Jiangsu experienced substantial urban and industrial land changes.
The rapid growth in the amount of land used for industrial/mining sites is seen largely in the eastern provinces, both in terms of absolute and relative changes, especially in Fujian, Jiangsu, Zhejiang, and Hebei (figure 4). With relatively smaller growth rates, Guangdong, Shandong, and Liaoning also saw a large amount of land converted to industrial/mining sites. The western provinces of Inner Mongolia, Qinghai, and Tibet witnessed rapid growth of land for industrial/mining sites but small absolute growth.
From 2004 to 2008, China launched a major drive to develop transportation networks by building more railways and highways to support economic growth. Nationally, land used for transportation grew at about 10 percent during this period. Many provinces witnessed faster growth in land used for transportation than the nation as a whole, including Inner Mongolia, Hebei, Qinghai, Jiangsu, Zhejiang, Fujian, Chongqing, Hubei, Anhui, Jiangxi, and Guangxi. Land requisition for highways was largely concentrated in the eastern provinces, with the largest absolute increases in Zhejiang, Jiangsu, and Hebei provinces.
Overall, China has witnessed remarkable land use changes, particularly in the eastern provinces and some central provinces. The spatial pattern of land use change is consistent with the spatial shift of economic growth, because eastern provinces enjoy institutional and locational advantages and agglomeration economies. They have attracted the majority of foreign investments, particularly those in capital- and technology-intensive industries, and are the dominant exporters of Chinese products.
Acceptance into the World Trade Organization has further benefited industrial firms located in eastern China with greater access to international markets. On the other hand, as industries continue to agglomerate, the eastern region has experienced rising land, workforce, and environmental costs, forcing some traditional industries to move to the central provinces. Some of these areas have attracted more recent investment and experienced faster economic growth, thus raising their importance among China’s regional economies.
Correlations Between Land Use Change and Economic Growth
To investigate the relationship between land use changes and economic growth systematically across cities and provinces, we calculate the correlation coefficients between the GDP growth rate from 2005 to 2009 and the rate of change of different land categories. The extent of the correlation may depend on a variety of economic, locational, and institutional conditions. We examine the impact of city size, location, and industrial structure, the amount of foreign direct investment (FDI), and land supply constraints on the relationship between land use changes and economic growth. The correlation coefficients are further computed using city subsamples classified by those factors.
The unexpected results showed that only a few significant but small correlation coefficients exist between the rate of change in land use and the economic growth rate (He, Huang, and Wang 2012). The change in other transportation land (including airports, ports, and pipelines) holds a significant positive coefficient. Correlation coefficients for urban land, industrial/mining sites, railways, and highways are barely significant.
Some evidence shows that city size, geographical location, fiscal situation, land supply, and realized FDI may moderate the correlation between land use change and economic growth. For instance, urban land expansion is associated with economic growth positively in central China but negatively in eastern and western regions. Stand-alone industrial/mining sites increase significantly with economic growth in western China. But overall, the correlation between the rate of land use change and economic growth is rather weak.
Since land can be treated as an input in the production function, the quantity of land may contribute directly to GDP growth. We compute the correlation coefficients between absolute GDP growth from 2005 to 2009 and absolute land use change from 2004 to 2008 to explore this relationship and find they are strongly correlated. Nationally, more cultivated land converted to nonagricultural uses contributes significantly to absolute GDP growth, with a correlation coefficient of -0.26. More land for urban uses and industrial/mining uses, are significantly and positively associated with GDP increases.
Significant correlation coefficients between land use change and economic growth suggest that land has been a significant driver of economic growth, but this positive contribution is moderated by a variety of factors including a city’s size, location, industrial structure, fiscal condition, and utilization of FDI. Conversion of cultivated land to nonagricultural uses is shown to contribute to economic growth, particularly in cities with more than 5 million people, realized FDI greater than US$200 million, strong agricultural land constraints, secondary industrial domiance, and location in central China.
Clearly, nonagricultural land is more productive than cultivated land in large and industrial cities. In recent years, as the implementation of central government policies targeted development in central China, the inland provinces have attracted more domestic and foreign investment and seen rapid economic growth as cultivated land has been converted to urban and industrial uses.
Comparatively, urban land expansion holds a stronger correlation with GDP growth in smaller cities and those located further inland. These types of cities are more likely to depend on land leasing to generate local revenues since they face more stringent fiscal constraints. In these areas, capital accumulation from land leasing is a typical local development strategy. In addition, urban land expansion plays a larger role in stimulating economic growth when fiscal limitations are steeper, land supply is strictly controlled, tertiary industries dominate, and more foreign investment is utilized. Industrial land expansion also contributes significantly to economic growth, especially in cities with stringent fiscal constraints and more industrial activities.
The recent transportation infrastructure development boom has contributed to economic growth as well. Land expansion for highways has stimulated economic growth with no constraints. Cities located in the western regions and those with poor fiscal revenues particularly benefit from new highways while expansion of railways is less associated with economic growth. The building of other transportation infrastructure (airports, ports, and pipelines) has played a critical role in facilitating economic growth in smaller and more eastern cities as well as in those whose economies are dominated by service industries.
The correlation analysis provides clear evidence to show that urban, industrial, and transportation land expansion is positively and significantly associated with economic growth. Converting cultivated land has contributed to economic expansion in many regions of China, but the importance of nonagricultural land expansion in economic growth is moderated by social, economic, and geographical conditions.
Conclusion and Discussion
Since the implementation of its economic reform, China has pursued a resource-intensive growth model that has forced land to play a critical role in sustaining its rapid economic growth. This has resulted in a large supply of developable land and rapid conversion from agricultural to nonagricultural purposes. Land in China is not only the outcome of economic growth but is also its driver.
The conversion of cultivated land to nonagricultural uses has been concentrated in the eastern and central parts of the country. With the implementation of new countryside development strategies and the enforcement of stricter land supply constraints, China witnessed a reduction in rural settlements across most of the central and northeastern regions. Urban and industrial land expansion has dominated land use changes throughout the nation. Transportation development, including new highways, railways, airports, seaports, and pipelines, has also been a major cause of land consumption in recent years, particularly in the eastern and central regions.
The principle component analysis based on land use change data from prefecture level cities indicated substantial spatial variation in land use changes among Chinese cities and showed that they are auto-correlated spatially. Correlation analysis further showed a weak relationship between the growth rate of GDP and the rate of land use change. But absolute land use change and absolute GDP growth are strongly correlated, indicating that land quantity is a critical input in economic growth.
Land is usually regarded as playing a marginal role in economic growth in Western economic growth theories. Our exploratory analysis suggests the opposite in China. As China urbanizes, industrializes, and globalizes, it is experiencing substantial land use changes that are correlated with economic growth. This significant relationship is associated with China’s particular state-owned land ownership and land use rights systems. As such, land can be used as a powerful macroeconomic intervention tool. The long-term lease of land use rights grants incentives for local governments to sell land to generate lump-sum revenues, which are then used to finance urban and industrial development and infrastructure provision.
Consequently, land has played a critical role in China’s rapid economic growth. However, this form of land-centered urbanization and industrialization has already caused serious social tensions, environmental degradation, and economic fluctuation. The lump-sum revenues generated by land leases are not sustainable considering that, even as large as it is, China has a limited land supply. The role of land as a driver of economic growth can be expected to decline as China gradually undergoes industrial advancement.
About the Authors
Canfei He is associate professor at the College of Urban and Environmental Science, Peking University, and associate director of the Peking University-Lincoln Institute Center for Urban Development and Land Policy in Beijing.
Zhiji Huang is a Ph.D. student at the College of Urban and Environmental Science, Peking University, and the Peking University-Lincoln Institute Center for Urban Development and Land Policy in Beijing.
Weikai Wang is a postgraduate student at the College of Urban and Environmental Science, Peking University, and the Peking University-Lincoln Institute Center for Urban Development and Land Policy in Beijing.
References
Bai, X., J. Chen, and P. Shi. 2011. Landscape urbanization and economic growth in China: Positive feedbacks and sustainability dilemmas. Environmental Science and Technology 46: 132-139.
China Land and Mine Resources Law Center. 2007. The evolution of land policy’s involvement in macro-control policies of China. China Land 6, 53-56 (in Chinese).
Ding, C., and E. Lichtenberg. 2011. Land and urban economic growth in China. Journal of Regional Science 51(2): 299-317.
He, Canfei, Zhiji Huang, and Weikai Wang. 2012. Land use changes and urban economic growth in China: An exploratory analysis. Working Paper. Beijing: Peking University-Lincoln Institute Center for Urban Development and Land Policy.
Lin, G. C. S. 2007. Reproducing spaces of Chinese urbanisation: New city-based and land-centred urban transformation. Urban Studies 44 (9): 1827-1855.
Lin, G. C. S., and S. P. S. Ho. 2005. The state, land system, and land development processes in contemporary China. Annals of the Association of American Geographers 95(2): 411-436.
Ministry of Land and Resources. 2008. Land use change survey data. People’s Republic of China.
Ping, Y. C. 2011. Explaining land use change in a Guangdong county: the supply side of the story. The China Quarterly 2107: 626-648.
Tao, R., F. Su, M. Liu, and G. Cao. 2010. Land leasing and local public finance in China’s regional development: Evidence from prefecture level cities. Urban Studies 47(10): 2217-2236.
Han transcurrido más de 20 años desde que un megaproyecto impulsado por el gobierno comenzó a transformar a Puerto Madero, el sector más antiguo del distrito portuario que se encuentra en la desembocadura del Río de la Plata en Buenos Aires, Argentina. Habiendo sido anteriormente un centro de decadencia que fomentaba el deterioro del centro adyacente, Puerto Madero es, hoy en día, un ícono turístico y un centro de progreso, ya que atrae tanto a la población local como a los visitantes hacia sus parques y actividades culturales. En Puerto Madero viven aproximadamente 5.000 habitantes nuevos y ha generado 45.000 puestos de trabajo en el área de servicios. Alberga numerosos referentes arquitectónicos nuevos, incluyendo el Puente de la Mujer, de Santiago Calatrava, y la casa matriz de YPF, obra de César Pelli. Además, el redesarrollo al que se sometió el puerto ha contribuido a la reactivación del centro de la ciudad, influyendo en las tendencias de desarrollo en toda la capital argentina.
Puerto Madero abarca 170 hectáreas en la zona cercana a la casa de gobierno (la Casa Rosada) en el centro y fue uno de los primeros proyectos urbanos de reacondicionamiento en América Latina a esta escala y nivel de complejidad. Fue un proyecto concebido como parte de una estrategia de desarrollo más amplia en todo el centro de la ciudad, que también incluía cambios en las normas sobre el uso del suelo, el reacondicionamiento de edificios y la construcción de viviendas de interés social en áreas tradicionales. En el presente artículo se analizan dos décadas de evidencias y experiencias respecto de este proyecto a fin de examinar hasta qué punto Puerto Madero ha logrado sus objetivos principales: contribuir a la reducción de patrones de desarrollo no deseados en la ciudad, afirmar a esta zona como el principal centro de la ciudad de Buenos Aires, estimular la economía de la ciudad y mejorar las condiciones de vida de todos los porteños.
El puerto en crisis
Puerto Madero fue abandonado como puerto a principios del siglo XX cuando todas las operaciones se transfirieron al Puerto Nuevo. Hacia fines de la década de 1980, Puerto Madero había sufrido varias décadas de abandono y desuso. Los terrenos eran propiedad de la Administración General de Puertos federal, pero tanto el gobierno de la ciudad como el gobierno nacional tenían jurisdicción sobre la planificación de esta zona. De manera similar, el Gran Buenos Aires, que aloja al 35 por ciento de la población argentina y produce el 46 por ciento del PIB, se encuentra gobernado por una superposición de instituciones que, con frecuencia, enfrentan problemas para trabajar en forma coordinada. Con el fin de simplificar este gobierno interjurisdiccional, se constituyó una empresa pública para gestionar el proyecto, cuyas acciones se dividen equitativamente entre el gobierno nacional y el gobierno de la ciudad. En 1989, el gobierno federal transfirió la propiedad de este sector del puerto a la nueva sociedad, la Corporación Antiguo Puerto Madero (CAPM).
Una vez recibida la transferencia de los terrenos del gobierno federal, el rol de la CAPM consistió en desarrollar el plan para este sector, definir un modelo financiero autofinanciado, encargarse de las mejoras por realizar en el sector asociadas con el proyecto, comercializar los terrenos y supervisar el proceso de desarrollo de acuerdo con los plazos y las pautas establecidas en el plan maestro. A diferencia de lo que ocurre con otras empresas similares en otras partes del mundo, que generalmente cuentan con un sustancial financiamiento público o acceso al crédito, la CAPM, por decreto, no recibiría recurso público alguno aparte de la transferencia de los terrenos y generaría sus propios ingresos para cubrir los costos operativos. El redesarrollo del puerto no podría haberse llevado a cabo de otra manera, ya que el gobierno federal estaba abocado a la recuperación fiscal y la creación de puestos de trabajo en medio de una crisis económica nacional.
Contexto y cronología del megaproyecto
Tal como ocurre en la mayoría de las ciudades latinoamericanas, el desplazamiento de actividades del centro tradicional de la ciudad de Buenos Aires había reducido el uso del sistema de transporte público y había dado como resultado un lento deterioro de los edificios del patrimonio histórico, muchos de los cuales se habían convertido en edificios de viviendas subestándar. La propuesta de redesarrollo de Puerto Madero fue parte de una estrategia más amplia concebida por la ciudad para proteger el patrimonio, promover el desarrollo en el centro, estimular la economía de la zona y contribuir a la reducción de estos patrones de asentamiento no deseados.
El desarrollo tuvo lugar en cuatro etapas. Durante la primera etapa (1989–1992), la CAPM vendió las antiguas propiedades que se encontraban en el extremo oeste del puerto, con lo que se inició así el proceso de redesarrollo y se cubrieron los costos iniciales del proyecto. En 1991, el gobierno de la ciudad y la Sociedad de Arquitectos firmaron un convenio para facilitar el Concurso Nacional de Ideas para Puerto Madero.
En el año 1992, los tres equipos ganadores trabajaron en colaboración para desarrollar el Proyecto Urbano Preliminar de Puerto Madero. El redesarrollo requirió una nueva geometría de subdivisión que permitiera llevar a cabo la con-strucción sin la necesidad de demoler las valiosas estructuras históricas. Muchos de los edificios históricos del puerto, tales como los depósitos, se restaurarían para darles nuevas funciones, con lo que se combinaría el valioso patrimonio histórico con el nuevo desarrollo.
Durante la segunda etapa (1993–1995), se otorgó el contrato del plan maestro a los ganadores del Concurso de Ideas. La propuesta original consistía en el desarrollo de 1,5 millones de metros cuadrados de superficie construida, concentrados en una ubicación central, con el fin de reactivar el centro de la ciudad. El plan, que contemplaba un horizonte de 20 años, comprendía actividades comerciales, establecimientos culturales y recreativos, cafés, restaurantes, servicios, estudios profesionales y actividades comerciales de mediana envergadura (tales como imprentas y empresas dedicadas a embalaje y depósito), que podrían ubicarse adecuadamente en los 16 antiguos depósitos portuarios renovados. A fin de compensar una evidente falta de espacios verdes en los alrededores del centro de la ciudad, se propusieron espacios verdes, tales como un parque central metropolitano, una reserva ecológica y la rehabilitación de la Costanera Sur. Dado el supuesto original de que predominarían los edificios de oficinas, la cantidad de unidades habitacionales prevista fue de menos de 3.000 (sin embargo, el uso residencial experimentó una mayor demanda, por lo que, en la actualidad, existen aproximadamente 11.000 unidades habitacionales).
Durante la tercera etapa (1996–2000), se realizó la mayor parte de las obras públicas y los gastos del proyecto aumentaron en gran manera junto con las ventas de terrenos. A lo largo de esta etapa, el costo por metro cuadrado de construcción no varió en forma significativa, ya que osciló entre 150 y 300 dólares por metro cuadrado hasta finales de la década (todos los precios mencionados se refieren a dólares estadounidenses). En esta tercera etapa, el perfil de los inversores había evolucionado de un grupo pionero inicial formado por pequeñas y medianas empresas que enfrentaban altos niveles de riesgo (1989–1993) a grandes firmas que invertían en productos de eficacia comprobada. Para el año 2001, quedaban pocos terrenos públicos para vender y la empresa pública poseía suficientes activos líquidos para finalizar las obras públicas necesarias para el proyecto. La cuarta etapa del desarrollo incluye dos fases: de 2001 a 2003, y de 2004 a la actualidad. Al principio, el proyecto sufrió las turbulencias económicas, financieras y políticas asociadas con la crisis fiscal de 2001, impulsada por la falta de pago del gobierno respecto de su deuda externa. Durante todo este período, la CAPM enfrentó altos niveles de incertidumbre gubernamental, por lo que las ventas de terrenos se detuvieron. No obstante, con posterioridad a las elecciones presidenciales del año 2003, el país retomó las negociaciones internacionales, reestructuró su deuda externa y mejoró significativamente sus condiciones económicas.
Al mismo tiempo, la CAPM pudo resolver ciertos litigios que existían sobre algunos terrenos, que posteriormente vendió y con cuyos ingresos pudo completar las obras públicas necesarias en el lugar.
A medida que los terrenos disponibles en Puerto Madero se volvían escasos, los desarrolladores recurrieron a las áreas que rodeaban el centro de la ciudad a modo de sitios alternativos para la inversión. La escala y complejidad del redesarrollo del puerto atrajo inversores que poseían conexiones más estrechas con los mercados financieros, tanto nacionales como internacionales. Muchos desarrolladores decidieron invertir en el centro en lugar de los suburbios. De esta manera, el proyecto tuvo éxito al redireccionar las tendencias del mercado para alinearlas con las prioridades de las políticas urbanas, un cambio que no hubiera existido sin la intervención del estado.
Logros del proyecto
En la actualidad, el proyecto se encuentra casi completo, con aproximadamente 1,5 millones de metros cuadrados de superficie construida, según lo planificado. Desde el comienzo hasta su finalización, los fondos para el proyecto provinieron completamente de la venta de terrenos y concesiones.
Para el año 2011, la CAPM había vendido aproximadamente 257,7 millones de dólares en propiedades, invertido 113 millones de dólares en obras públicas, e incurrido en unos gastos generales de cerca de 92 millones de dólares, entre honorarios de gestión y otros gastos operativos. Los precios inmobiliarios aumentaron de 150 dólares el metro cuadrado a principios de la década de 1990 a 1.200 dólares el metro cuadrado en la actualidad. El proyecto atrajo una cantidad considerable de inversiones del sector privado, además de la transferencia de terrenos del estado.
El proyecto agregó cuatro masas de agua de grandes dimensiones (por un total de 39 hectáreas) y 28 hectáreas de espacios verdes al sistema de parques de la ciudad. También se facilitó la apertura de la reserva ecológica y se renovó el acceso a la explanada sur, conocida como la Costanera Sur, diseñada a principios del siglo XX por Jean-Claude Nicolas Forestier, quien también diseñó el Paseo del Prado en La Habana, Cuba. El centro adyacente representa nuevamente el punto de referencia indiscutido de la actividad pública, administrativa, financiera y comercial de alto nivel.
Puerto Madero fomentó además el crecimiento económico de la zona que, en última instancia, se tradujo en una mayor recaudación impositiva. Como iniciativa estatal, desencadenó más de 2,5 mil millones de dólares en inversiones privadas, con un valor actual de más de 6 mil millones de dólares. Aunque no tenemos a disposición datos contables completos, los ingresos derivados del impuesto a las ganancias societario se estiman en 158 millones de dólares, y los impuestos pagados por la empresa pública ascienden a 19,86 millones de dólares. Los nuevos propietarios de los inmuebles pagan aproximadamente 12,4 millones de dólares al año en concepto de impuestos inmobiliarios al gobierno de la ciudad. Una vez que haya finalizado la construcción, se calcula que los ingresos por impuestos inmobiliarios alcanzarán 24,3 millones de dólares al año.
El proyecto también estimuló el crecimiento del mercado laboral. Al día de hoy, las construcciones privadas en Puerto Madero comprendieron cerca de 450 millones de dólares en costos laborales, es decir, el equivalente a 900.000 meses de trabajo o 3.750 empleos por año, distribuidos en 20 años. Las inversiones del proyecto en obras públicas generaron 313 empleos por año durante 20 años, además de 26.777 empleos administrativos para el año 2006 y 45.281 empleos en el área de servicios para el año 2010. Estas cifras demuestran el papel vital que este proyecto ha representado en la estimulación de la economía de la ciudad.
Reducción de la rentabilidad
A pesar del éxito general de Puerto Madero, para muchos observadores, los resultados sociales no fueron satisfactorios. La causa principal fue la rápida venta de grandes parcelas de terreno durante el período de venta más dinámico, es decir, de 1996 a 1999. Algunas de estas parcelas tenían el tamaño de una cuadra completa del centro y, en la actualidad, se encuentran ocupadas por torres que funcionan, de alguna manera, como comunidades verticales cerradas. Además, resultó necesario que las empresas de mayor envergadura y mejor equipadas se encargaran de los enormes volúmenes de construcción, lo que excluyó a las pequeñas y medianas empresas. Así, la morfología de las grandes parcelas de terreno definió esencialmente los tipos de empresa y los tipos de producto que se ofrecerían y el perfil social de los posibles compradores.
Además, la estrategia de comercialización de los desarrolladores privados influenció el discurso general del proyecto, diluyendo así los objetivos de inclusión social de la gestión pública con el fin de favorecer la creación de un barrio de características exclusivas. Los ciudadanos con alto poder adquisitivo y los empresarios de alta gama codician los espacios residenciales y comerciales de Puerto Madero. A la CAPM le resulta difícil proteger el carácter público aun de los nuevos espacios abiertos del distrito, como por ejemplo la reserva ecológica, debido a que los residentes del distrito portuario con alto poder adquisitivo desalientan en gran manera la realización de actividades recreativas y deportivas que pudieran atraer a los porteños provenientes de toda la ciudad. En este sentido, la CAPM se limitó a articular los intereses de los empresarios privados y los residentes existentes, ignorando las políticas diseñadas para el beneficio de muchos habitantes de la ciudad. Las viviendas económicas y otros elementos que hubieran garantizado la diversidad en la demografía residencial de la zona no formaban parte de la tarea encomendada a la CAPM. Se planificaron varios programas sociales con este objetivo como parte de la estrategia más amplia para el centro de la ciudad, pero estos programas nunca se materializaron, lo que generó el aislamiento de Puerto Madero como un área de desarrollo para una elite.
La escala del proyecto de Puerto Madero, que hubiera sido imposible de gestionar y demasiado riesgosa para los inversores privados en ese momento, demuestra que el sector público es capaz de asumir un papel de liderazgo en el desarrollo de la ciudad. Sin embargo, también demuestra que los estándares socialmente progresivos son difíciles de mantener una vez que el proyecto se vuelve prestigioso y los crecientes valores inmobiliarios aumentan la presión impuesta por los desarrolladores privados. La capacidad de Puerto Madero de autofinanciarse representó una espada de doble filo. Por un lado, permitió que se llevara a cabo un proceso de desarrollo dirigido por el estado sin incurrir en costos del gobierno. Debido a que la empresa pública podía diferir el pago de dividendos a sus accionistas, fue capaz de capitalizar las ganancias obtenidas por las ventas de los terrenos y reinvertirlas en obras y servicios públicos destinados a la zona. El barrio abierto y accesible, dotado de obras de infraestructura pública y espacios abiertos, protegía en gran medida el interés público. Asimismo, el proyecto estimuló la actividad económica y contribuyó a un patrón de desarrollo general más eficiente en toda la ciudad, los cuales representan dos objetivos importantes de la gestión pública.
Sin embargo, los resultados habrían sido mejores si hubiera existido un apoyo financiero proveniente de préstamos de agencias multilaterales a fin de coordinar en forma óptima el ritmo de las ventas y tomar mejores decisiones a largo plazo que impulsaran el beneficio público del proyecto. La flexibilización de los requisitos de licitación sobre lotes de grandes dimensiones durante la segunda mitad de la década de 1990 aumentó las ventas, aunque provocó que la mayor parte de la plusvalía de los terrenos derivada del último aumento de precios inmobiliarios se devengara a favor de los grandes inversores que se habían comprometido en primera instancia.
En el año 2011, la CAPM transfirió el mantenimiento de todas las áreas desarrolladas a la ciudad y se comprometió a finalizar las restantes obras públicas para el año 2013. En la actualidad, los ingresos y los gastos de la CAPM están equilibrados. Los ingresos se ven limitados al alquiler de los diques y los lugares de estacionamiento. Los bienes de la CAPM consisten en varias propiedades (oficinas, lotes), cuyo producto constituye las ganancias de la empresa y cuyo valor de mercado se calcula en aproximadamente 50 millones de dólares. Estas ganancias podrían servir para iniciar nuevos emprendimientos de capital, o podrían transferirse a los accionistas cuando decidan disolver la CAPM. La solidez de los estados contables de la CAPM es una realidad, aunque la crítica de las que fue objeto durante el desarrollo de Puerto Madero podría constituir un obstáculo al acceso del gobierno a nuevos emprendimientos.
La inversión pública inicial en Puerto Madero fue de 120 millones de dólares, conformada por el terreno (tasado originalmente en 60 millones de dólares) y un conjunto de servicios intangibles, tales como el diseño del proyecto, la reconocida experiencia y la consultoría. Las ventas totales de terrenos ascendieron a 257,7 millones de dólares, con un costo general (administración, impuestos) de cerca de 92 millones de dólares (sin contar los costos de puesta en marcha, que no implicaron operaciones monetarias), lo que deja una modesta tasa de retorno. Aunque los precios deberían haber sido promocionales durante la etapa inicial del desarrollo, los valores de venta podrían haberse aumentado al transcurrir el tiempo si dichas ventas se hubieran programado con el fin de aprovechar el aumento de los precios de mercado. Para obtener tasas de retorno más altas, hubiera sido necesario un valor de venta promedio más alto, una mejor programación de la venta de los terrenos y un compromiso más modesto en cuanto a las obras públicas, tales como la infraestructura, el espacio público y los parques. La CAPM podría haber ahorrado una cantidad considerable si la construcción de puentes y pasarelas no se hubieran extendido más allá del perímetro del proyecto, bajo la jurisdicción municipal.
Los resultados del proyecto hubieran sido muy diferentes si los terrenos se hubieran vendido sin mejoras o si el proyecto hubiera estado en manos de desarrolladores privados. En este sentido, resulta importante destacar que, al momento de esbozar el proyecto, el riesgo se consideraba, en general, alto, y la escala de inversión superaba la capacidad de los inversores privados locales. De manera similar, los inversores internacionales no hubieran estado dispuestos a asumir este nivel tan alto de riesgo sin mayores concesiones de parte del gobierno. Además, los desarrolladores privados estaban interesados en promover proyectos de gran envergadura con acceso restringido casi exclusivamente a los propietarios. Mediante el control ejercido por el gobierno a través de la empresa pública se garan-tizaron ciertos atributos finales del proyecto, tales como el aporte de espacios públicos y el carácter holístico del desarrollo, con el fin de asegurar los beneficios para la comunidad.
Conclusión
Podría decirse que los objetivos originales del proyecto (estimular la actividad económica, afirmar el rol del centro de la ciudad, contribuir a la reducción de patrones de desarrollo no deseados y mejorar las condiciones de vida) se han cumplido. El proyecto de Puerto Madero generó empleos, estimuló la economía de la ciudad, atrajo grandes niveles de inversiones y sumó complejidad al centro de la ciudad, lo que contribuyó a su preeminencia y dio como resultado mejoras en las áreas circundantes. Creó además espacios abiertos de alta calidad, renovó el sistema metropolitano de parques y mejoró el patrón general de desarrollo en Buenos Aires.
No obstante, la relajación de los controles de calidad, el amplio alcance de los proyectos y la rapidez con que se han vendido los terrenos en ciertos momentos provocaron una reducción de los posibles ingresos que el proyecto hubiera podido devengar en beneficio del sector público y redundaron en una disminución de la capacidad de redistribución de esta iniciativa. El acceso al crédito hubiera fortalecido la posición de la CAPM y permitido una programación cuidadosa de las ventas de los terrenos y de las mejoras en la zona. Resulta alentador que la ocupación residencial haya excedido en gran medida las proyecciones originales, con lo que se consolidó una tendencia de repoblar el centro de la ciudad, aunque el proyecto debería haber incluido un porcentaje de viviendas económicas.
Estos resultados revelan la complejidad de llevar a cabo múltiples iniciativas con el fin de obtener un resultado social equilibrado. Puerto Madero no logró incorporar una mayor combinación social, debido a que no se llevaron a cabo otras estrategias para el centro de la ciudad, como por ejemplo la recuperación de edificios del patrimonio histórico. Las futuras iniciativas de gestión de proyectos urbanos deberían contemplar factores que aseguraran la continuidad de las políticas. Dentro de este marco, resulta importante impulsar la participación entre los beneficiarios de intervenciones específicas, tales como las viviendas económicas, ya que su participación y compromiso representan la garantía más sólida para la continuidad de las políticas.
Finalmente, el proyecto de Puerto Madero señala la capacidad que el estado ha demostrado tener al tomar la iniciativa de dirigir el proceso de desarrollo urbano. En este caso, el estado dejó a un lado su rol normativo y se hizo cargo de una iniciativa de redesarrollo importantísima. La CAPM demostró su capacidad de sustentar un complejo proyecto de regeneración urbana durante un tiempo prolongado y de mantenerse a flote en medio de un clima político turbulento y una grave crisis económica. La constitución de la empresa pública representa una innovación creativa en cuanto a la gestión urbana, ya que ofrece un claro ejemplo de cómo lograr el auto-financiamiento de un proyecto y la cooperación interjurisdiccional respecto del gobierno urbano. En este sentido, la experiencia de Puerto Madero sirve como un modelo convincente para la gestión urbana interjurisdiccional y reafirma el rol positivo que puede representar el estado en las iniciativas de planificación de la ciudad.
Sobre los autores
Alfredo Garay fue secretario de planificación en Buenos Aires cuando comenzó el megaproyecto Puerto Madero, y todavía se desempeña en el directorio de la CAPM. Arquitecto y catedrático en la Universidad de Buenos Aires, Garay ha recibido numerosos premios nacionales e internacionales en los campos de gestión urbana y organización de intervenciones de gran envergadura..
Laura Wainer es arquitecta y planificadora urbana en Buenos Aires. En el año 2012, recibió la beca Fulbright, la beca internacional de investigación Delta Kappa Gamma y la beca del presidente de la New School de Nueva York.
Hayley Henderson se ha desempeñado como planificadora urbana en Buenos Aires y en Brisbane, Australia. En la actualidad, es candidata a un doctorado en planificación urbana en la Universidad de Melbourne, Australia.
Demian Rotbart es arquitecto, planificador urbano y profesor adjunto de planificación urbana en la Universidad de Buenos Aires.
Old-timers in Detroit like to recall the 1950s and ’60s as a Golden Age of urban planning. Under Charles Blessing, the city’s charismatic head planner from 1953 to 1977, Detroit carried out a series of ambitious attempts to reshape its urban landscape. Sweeping aside a century’s worth of tenements and small commercial structures, it created the Mies van der Rohe–designed Lafayette Park residential development just east of downtown, a light industrial park west of downtown, and block after block of low-rise moderate-income housing on the north side. Edward Hustoles, a retired veteran planner of those years, recalls how Blessing enjoyed such status as Detroit’s visionary that over lunch at a nice restaurant he would sketch his plans all over the tablecloth; if a server complained, Blessing would roll it up and tell her to put it on his bill.
Times change. Blessing retired in the 1970s, and by then Detroit was mired in its long-agonizing slide into Rust Belt ruin. The twin scourges of deindustrialization and suburban sprawl, which hurt so many cities in the American heartland, hit Detroit particularly hard. Numerous factories, so modern when they were built in the early 20th century, looked obsolete by the 1950s and ’60s, and were mostly abandoned by the end of the 1980s. The new car-enabled culture of suburbia, aided and abetted by federal highway building and other measures, encouraged hundreds of thousands of residents to flee the city for Birmingham, Troy, and other outlying communities. The exodus was hastened by fraught race relations, which grew especially toxic after the 1967 civil disturbances. Without inhabitants, Detroit’s vast stock of small wood-frame worker housing moldered; arson, crack, metal stripping, blight, and other ills corroded entire neighborhoods, forcing the city to raze block after block of homes in the 1990s and 2000s—a trend accelerated by the 2007–2008 real estate crisis, which compounded a vicious cycle of property tax delinquency and foreclosure, decimating what remained of Detroit’s housing market. Today, the best estimates suggest that at least 24 square miles of Detroit’s 139-square-mile land area are empty, and another six to nine square miles have unoccupied buildings that need to come down. Add in municipal parks that the city no longer maintains and abandoned rights-of-way like old railroad lines, and 25 percent of Detroit—an area larger than Manhattan—is vacant.
By the 1990s, urban planning had become obsolescent as a focus and a guide. A series of mayors tended to latch onto whatever showcase projects came along—the much-maligned Renaissance Center in the 1970s, or casino gaming in the late 1990s. Detroit’s municipal planning department found a new role administering federal community development block grants, and, in recent years, the department had more accountants than planners. But in 2010, then-Mayor David Bing initiated a strategic attempt to address the problem of widespread vacancy and the burden it placed on municipal services and budgets. That effort culminated in 2013 with the publication of Detroit Future City, the 354-page comprehensive framework for how Detroit might strengthen and regrow its troubled neighborhoods and repurpose its empty lots and buildings over the coming decades. Advocating widespread “greening” strategies—including “productive landscapes” that would put vacant land to new use through reforestation, rainwater retention ponds, the installation of solar panels, and food production—Detroit Future City won praise as a visionary new way to think about older industrial cities and to include ordinary citizens in the conversation about their future. “In the annals of civic engagement and community planning, Detroit Future City is probably the most extensive community outreach and planning exercise that I’ve ever encountered,” said George W. McCarthy, president and CEO of the Lincoln Institute of Land Policy.
Origins and Essence
By 2010, three years before Detroit would file the largest municipal bankruptcy in U.S. history, the population had dwindled to 700,000 from its peak of 1.85 million in 1950. Then-Mayor David Bing needed to realign city services to account for the diminished tax base and thinning of the urban streetscape. His initial suggestion to reporters that he would move the few remaining inhabitants out of some of Detroit’s most abandoned “ghost” neighborhoods drew blistering comparisons to the urban renewal projects of the past and even hoots of “ethnic cleansing”; the idea was quickly shelved. Also that year, the mayor and top aides staged a series of community meetings called Detroit Works to elicit a dialogue with citizens about the need to rethink how the city should operate in the future. But residents had other ideas. The meetings quickly devolved into chaotic complaint sessions where hundreds of residents demanded better street lights, police protection, and other city services fast.
McCarthy, who was then with the Ford Foundation and a supporter of Detroit’s revitalization efforts, said leaders should have known better. “When you bring normal citizens into the planning process, they enter the exercise as if it’s a public meeting and the way to be heard is to shout the loudest,” he said. “If you’re sincere about civic engagement, you have to take the time to train citizens to be planners. You have to devote a significant amount of time and attention to get people to understand that planning is about making difficult decisions in a constrained environment.”
With funding from the Kresge Foundation and other sources, the city regrouped and hired teams of consultants, including nationally respected planning staffers such as Project Director Toni L. Griffin, professor and director of the J. Max Bond Center on Design for the Just City at the Spitzer School of Architecture at the City College of New York. Under Griffin’s leadership, they began to map out the document that would become Detroit Future City.
The group took pains to avoid the word “plan” when they presented it to the public. Unlike a conventional master plan, which basically creates a map of what uses will go where before the private sector comes in to fill it out with development, Detroit Future City is a strategic framework for thinking about different neighborhood types and how each might evolve given existing trends.
“We did not want to leave the city with static illustrative pictures of what their city could look like,” Griffin says. “There were already lots of those around. We wanted to leave the city with a tool that would enable people to manage change, because as you know Detroit is still very much in flux in terms of its governance, fiscal structures, city services, population loss, and ever-changing composition of land vacancy.”
The framework had to enable decision makers to act as that change was occurring over various periods of time. “It offers different decision-making structures that allow someone to say, if this is your condition today, here are the kinds of options you might think about to move that condition from A to B,” Griffin says. To simplify: If a neighborhood is showing a significant and growing level of vacancy but still retaining some useable housing and commercial stock, the vacant land there could be converted to food production or to a solar panel field to power local businesses. But a neighborhood with little vacancy and with much higher levels of density might plan infill development for its few vacant lots. Rather than suggesting that the corner of Woodward Avenue and 7 Mile Road ought to get a shopping center, the framework offers a series of examples of what might take place given certain neighborhood typologies. The mantra became “every neighborhood has a future, just not the same future.”
Detroit Future City’s greening strategies were particularly important and drew the most attention because of the huge amount of vacant land where development is not a realistic option and probably won’t be for many years to come; perhaps one-third of the entire city cries out for some new purpose and use. The more vacant spots on the map could be rendered productive by the installation of fields of energy-producing solar panels, reforestation, farming, or “blue infrastructure,” such as rainwater retention ponds, bioswales, and canals that provide water for agriculture and that redirect rainwater and snowmelt away from Detroit’s already overburdened combined sewer system. Almost all these uses presumably would be private endeavors but would require city permitting and perhaps other assistance, including zoning changes or partnerships with various philanthropic or nonprofit groups. “You need to have a greening strategy, so you can use this land in ways that, at a minimum, don’t drag down existing populated areas and, at a maximum, enhance the quality of life, economic productivity, and environmental quality for the people of Detroit,” says Alan Mallach, a Detroit Future City consultant, nonresident fellow of the Brookings Institution, and author of Regenerating America’s Legacy Cities, published by the Lincoln Institute.
But the plan also envisions significantly greater population densities in those areas of Detroit already undergoing a rebirth, such as the Greater Downtown area, where young professionals have sparked a recent residential boom and where companies led by Quicken Loans, which moved downtown in 2010, have filled up previously vacant office towers. It suggests that Detroit’s existing hospital and manufacturing corridors could and should see concentrated new investment to beef up job training opportunities and new residential and retail development in those nodes. Key employment districts could be linked by new public transit options, such as the M-1 Rail streetcar line now under construction along Woodward Avenue, the city’s main street, thanks to public-private financing. Construction began in mid-2014 on the $140-million, 3.3-mile line, which will connect downtown from Jefferson Avenue to the city’s New Center area, another hub of activity, running through the rapidly revitalizing Midtown district. The line is expected to be finished in late 2016. If voters approve a new property tax millage expected to be on the ballot in 2016, M-1 could be followed by a regionwide bus rapid transit system to be built out over the next several years.
Mallach describes Detroit Future City “as a reality check against what’s actually happening, against how you’re spending your money, where you’re making your investments, what you’re prioritizing, and so forth.”
“Detroit Future City offers a menu,” he adds. “It doesn’t say this site should become an urban farm; it lays out the options.”
Civic Engagement
Deciding what would happen where would be left to the political process—with neighbors, city leaders, and other stakeholders all taking part. Thus, public input would be critical to success.
In 2012, the Detroit Future City team hired Dan Pitera, a professor at the University of Detroit Mercy (UDM) School of Architecture, to design a new and better civic engagement strategy to harness and direct residents’ desire for change. Efforts ranged from informal chat sessions at a “roaming table,” designed by UDM architecture students and set up at various locations in town, to a series of meetings at community centers, where 100,000 residents engaged in discussions that informed the urban rehabilitation.
During this planning stage in 2012 and early 2013, a new walk-in office in the Eastern Market district allowed residents to meet staffers, see plans, take surveys, and the like. Those working at the office included staffers from UDM’s Detroit Collaborative Design Center, directed by Pitera, and the nonprofit Community Legal Resources. Pitera’s group also created a mobile phone app to encourage community involvement. And the team created 25 color posters keyed to city issues, such as vacant land or community gardens, for distribution by the thousands throughout the city.
During one Saturday morning meeting in 2012 at the Detroit Rescue Mission, some 50 residents got a peek at what various neighborhoods might become depending on current conditions and residents’ desires. Some of the attendees gave positive reviews. “The conversation is just what we need to get back to the real issues,” said Phillis Judkins, 65, of the North End district. And Larry Roberts, 70, who lives in Detroit’s Indian Village neighborhood, said the 2012 public meetings were more productive than the somewhat chaotic mass meetings Detroit Works held in the fall of 2010. “Today it looks like there are people with ideas that can move forward,” he said.
Some skepticism remained, of course, about how many of the good ideas would become policy in the cash-strapped city, and how many might ever be carried out. “If the city government buys into this plan and communicates to us what they’re going to do, I think it will work out all right,” Roberts said.
Under current Mayor Mike Duggan, who took office in 2014, a roster of neighborhood offices have opened to deal more closely with citizens and their concerns than previous administrations had done. The level of community involvement to date has been evidence that Detroiters have not given up on their neighborhoods, even in the hardest hit areas.
Rubber Hits the Road
Happily, concerns that Detroit Future City would sit on the shelf gathering dust like so many previous documents in Detroit seem unfounded. With Kresge’s financial backing and leadership, the Detroit Future City (DFC) Implementation Office was established as a nonprofit charged with realizing the plan’s visions and suggestions. Dan Kinkead, an architect who helped to write Detroit Future City, was appointed director of projects. The group now has a fixed location in Detroit’s New Center district and a staff of about 12, including staffers available through various fellowship programs underway in the city. Kenneth Cockrel, a former president of the Detroit City Council who briefly served as interim mayor after then-Mayor Kwame Kilpatrick resigned in disgrace in 2008, was hired at the end of 2013 to be director of the implementation office.
In early 2015, the implementation office had multiple pilot projects underway in partnership with other organizations. These include:
Solar Fields. Working with Focus: HOPE, a nonprofit job training facility in the city, and a small start-up, the DFC team is planning to cover some 15 acres of vacant land with solar panels. Kinkead estimates that the field could produce five megawatts of energy—enough to power several hundred houses. Planners hope to start the project this year or next, but it was unclear how many people it might employ.
Rainwater Retention Ponds. On Detroit’s east side, the DFC staff is considering the creation of a series of rainwater retention ponds in a residential neighborhood to keep rainwater out of the sewer system. The neighborhood, known as Jefferson Village, had been targeted for new single-family housing some 15 years ago, but that project stalled for lack of funding, leaving dozens of vacant lots and little demand for them. So with funding from the local Erb Foundation, and consulting with the Detroit Water & Sewerage Department, the DFC team is targeting several dozen vacant lots for the treatment. They envision that nearby homeowners could see a rate reduction on their water bills, because the department will no longer have to build and maintain as much big-pipe infrastructure to clean up rainwater that mixes in with wastewater. If the effort proved successful, they would expand it citywide.
Roadside carbon buffers. With the nonprofit Greening of Detroit tree-planting organization, one of DFC’s recommendations—to plant trees as carbon buffers alongside major roads and highways—saw one of the city’s largest-ever tree-planting blitzes in late 2014 on Detroit’s west side near the Southfield Freeway, a major north-south connector. Volunteers planted some 300 trees in one day along a few blocks. When mature, they will absorb at least some of the carbon emissions from the freeway.
Trish Hubbell, a spokesperson for the Greening of Detroit, said that partnering with the DFC implementation team on such efforts raises the visibility of each project, which in turn helps with fundraising. And the DFC team brings a wealth of knowledge on land use issues to any effort.
“Their biggest value is that they have the framework, and so they help steer where things go,” Hubbell said. “The framework adds value to all the opportunities out there.”
The Urban Farming Controversy
One controversial land use the office has championed stems from a trend Detroit is already well-known for—urban agriculture. Over the past 15 years, Detroit has seen well over 1,000 small community gardens started, including such nationally recognized projects as Earthworks and D-Town Farm, each of which covers a few acres. But currently volunteers perform almost all the farming activity, and the food is consumed by neighbors, donated to food banks, or in a few cases sold at local farmers markets. Detroit has undertaken a lively debate in recent years over the possibility of expanding into large-scale for-profit agriculture. Projects like Hantz Farms and RecoveryPark have mapped ambitious plans to convert hundreds of acres to food production. But each effort remains relatively small scale at the moment, as the debate on the wisdom of large-scale farming continues.
Nevertheless, the DFC team seems committed to much greater food production inside the city, both on vacant land and in abandoned factories where hydroponic farming could take place. The DFC team, for example, is working with the RecoveryPark effort to plan a rainwater retention system to help water crops.
At the very least, farming inside the city could help some local food entrepreneurs grow their businesses, create some jobs, and strengthen the tax base, if only on a modest scale. Food production also helps knit communities together around a purposeful activity, raises nutrition awareness, and puts blighted vacant lots and factories to a productive new use. “Detroit has the opportunity to be the first globally food-secure city,” Kinkead said.
But city officials have yet to sign off on large-scale for-profit farming, fearing that nuisance problems including dust, noise, and odors, will get out of hand. Others question whether the tough economics of farming—back-breaking labor performed mostly by minimum-wage migrants—would ever produce the sort of revenue and jobs to justify the effort. McCarthy remains one of the skeptics. “I thought it was a bad idea to try to grow food,” he says. “The economics just aren’t there; the costs are prohibitive, given the fact that you don’t have to drive that far to get out into perfectly good farmland outside Detroit at one tenth the cost.” So the debate continues, with the DFC implementation team working toward greater use of Detroit’s vacant land for food production.
Consensus Building
Rather than ignoring Detroit Future City as the product of a previous administration, Mayor Duggan has publicly embraced it as his guide. His top aide for jobs and the economy refers to his well-worn copy of Detroit Future City as his “Bible” for reshaping the city.
Jean Redfield, CEO of NextEnergy, a Detroit nonprofit working toward a sustainable energy future for the city, keeps a copy of Detroit Future City on her desk. “I use it a lot to go back to specific language they use to talk about specific options,” she said. “I use some of the maps and statistics pretty regularly.” And NextEnergy teams up with the DFC implementation team in planning a variety of green-and-blue infrastructure projects. “Our paths cross pretty often,” she said. “Whenever there’s a Department of Energy or City of Detroit question or challenge around land use, energy infrastructure, street lighting, or solar projects, we’re often working side by side with the folks there.”
As mentioned, the implementation team acts more as a lead advisor to other agencies, such as Greening of Detroit or the city’s Water & Sewerage Department, than as a primary actor. DFC Implementation Director Kenneth Cockrel calls the team a “nongovernmental planning agency.” He explains, “We inform decision making, but we are not decisions makers. Ultimately, what’s in the framework is going to be implemented by the mayor and by city council if they so choose to buy into it. They’re the ones who are going to drive implementation.”
Continuing, Cockrel likens the implementation of Detroit Future City “to what happens when a book gets made into a movie. You don’t film the book word for word and page for page. Some stuff gets left out, other stuff winds up on screen. I think that’s ultimately probably going to be the approach that the Duggan administration will take.”
Like any new organization, the DFC team continues to refine its role and search for where it can contribute most. Kinkead agrees their role may best be captured in a paraphrase of the old BASF corporate slogan: the DFC team doesn’t do a lot of the innovative projects in Detroit; it just makes a lot of those projects better.
“We exist in a squishy world,” Kinkead says. “It’s a different kind of ballgame, but our ability to help others is how we do what we do.”
In early 2015, it seemed clear that many of the innovative ideas at the heart of Detroit Future City—greening strategies, energy production, trees as carbon buffers, new development targeted toward already dense districts—ideas that seemed far-fetched even in 2010, when then-Mayor Bing launched his Detroit Works effort, now approach mainstream status.
“Now, it’s not just the environmentalists or the climate change folk talking about carbon forests; it’s residents and the executive directors of community development corporations,” Griffin says. “Business leaders and philanthropists are talking about the importance of this. A broader spectrum of constituents talking about issues that aren’t necessarily central to their wheelhouse is a very important outcome of the work.”
Perhaps just as important is the widespread realization that Detroit needs to deliver municipal services in a different way, given the realities of the city’s financial woes and population loss. The city successfully emerged from bankruptcy in late 2014, but at best that gave Detroit some breathing room to begin to grow again. If and when growth resumes, the city has to guide it more smartly than in past periods of expansion, when development sprawled across the landscape in haphazard fashion.
The Road Ahead
One reason why the city and its people were ready for a document like Detroit Future City was the deep understanding that deindustrialization and suburban sprawl had led to Detroit’s problems. “Residents began to understand that they were effectively subsidizing the sprawl and disinvestment. They began to think about ways to change these systems to be more efficient,” Griffin says.
As this article was being prepared for publication, Detroit took another big step toward revitalizing its long-dormant planning activities. Mayor Duggan announced that he had recruited Maurice Cox—the highly regarded director of the Tulane City Center, a community-based design resource center for New Orleans, and associate dean for Community Engagement at the Tulane University School of Architecture—to serve as Detroit’s new director of planning. In New Orleans, Cox facilitates a wide range of partnerships among Tulane University, the New Orleans Redevelopment Authority, and the City of New Orleans. In Detroit, among other activities, he will help turn some of Detroit Future City’s general framework into specific planning recommendations.
If innovative planning is back in style, as it appears to be, it’s more decentralized, less focused on big projects, and more attuned to how conditions on the ground might demand different solutions in each neighborhood. And the number of voices heard in planning discussions is greater than ever before. Perhaps Detroit Future City’s final and most important contribution is that it has empowered neighborhoods and citizens as equal partners with high-level professional planners in deciding the future direction of the city.
Indeed, Detroit Future City launched a new age of planning, and it will look little or nothing like that of Blessing’s era. “Planning has certainly returned, but it’s fundamentally different from how it was 50 years ago,” says Kinkead. “In the 1950s and ’60s, the city’s broader planning objectives were often manifest from a single municipal government elite.”
“To move the city forward it takes everybody,” Kinkead says. “It’s not just Detroit Future City. It’s not just the government. It’s not just the business sector. It’s everybody working together.”
John Gallagher covers urban development issues for the Detroit Free Press. His books Reimagining Detroit: Opportunities for Redefining an American City and Revolution Detroit: Strategies for Urban Reinvention are available from Wayne State University Press.
References
Detroit Future City. 2012. Detroit Future City: 2012 Detroit Strategic Framework Plan. Detroit, MI: Inland Press.
Mallach, Alan and Lavea Brachman. 2013. Regenerating America’s Legacy Cities. Cambridge, MA: Lincoln Institute of Land Policy.
Skidmore, Mark. 2014. “Will a Greenbelt Help to Shrink Detroit’s Wasteland?” Land Lines 26 (4): 8–17.
Hace casi 30 años, Amalia Reátegui y su esposo, Eusebio, empacaron sus pertenencias, reunieron a sus ocho hijos y se mudaron a su nuevo hogar: un polvoriento lote en la árida periferia de Lima, la capital de Perú. Al principio, la vida no fue fácil allí. No disponían de servicios básicos, como agua corriente y electricidad. Las calles no estaban pavimentadas y el transporte público era inexistente. Las escuelas y clínicas sanitarias de calidad se encontraban muy lejos, en los barrios más ricos y establecidos.
Sin embargo, aunque las condiciones eran muy duras, mudarse a San Juan de Lurigancho (uno de los primeros asentamientos informales de Lima) le ofrecía a esta pareja una posibilidad excepcional de convertirse en propietarios, lo que hubiera estado fuera de su alcance en los distritos tradicionales de la ciudad.
Poco a poco, las cosas fueron mejorando. Construyeron una maciza casa de hormigón, consiguieron electricidad y, unos años más tarde, agua corriente y alcantarillado. Llegaron los autobuses e incluso un metro que conecta San Juan de Lurigancho con el resto de la ciudad. Sus hijos lograron realizar estudios terciarios y obtuvieron empleos en hospitales, en el municipio y en la marina.
Para Amalia y Eusebio, igualmente importante fue un papel que le dio el gobierno: el título que reconocía que eran propietarios formales del terreno de 120 metros cuadrados en el que vivían.
Hoy en día, la pareja sigue viviendo en la misma casa color durazno, aunque su hogar –al igual que el barrio– ha experimentado transformaciones a lo largo del tiempo. La casa, que tenía originalmente un solo piso, es ahora un edificio de cuatro pisos que alberga ocho apartamentos de dos dormitorios, uno para cada uno de sus hijos adultos.
Para Amalia, una abuela de 71 años de edad de hablar pausado y cabello negro que le llega al hombro, esto fue siempre parte del plan. “Al principio, cuando construimos la casa”, dice, “siempre pensé que sería para mis hijos. Es mi casa y es para ellos”.
Sin embargo, para sus hijos, que gastaron el equivalente a decenas de miles de dólares en la construcción de los pisos superiores, la situación en la que viven actualmente los deja en un limbo legal, donde la propiedad de sus apartamentos se fundamenta solamente en un acuerdo verbal con sus padres, en lugar de documentos legales.
Volver a la informalidad
Este caso pone de relieve una nueva tendencia que tiene desconcertados a los expertos en desarrollo urbano y derechos de propiedad en Perú. Después de años de pedir títulos legales de propiedad para sus casas, los residentes dejan ahora que sus propiedades queden fuera de la regularización, ya que no utilizan la Superintendencia Nacional de los Registros Públicos (SUNARP) para documentar operaciones inmobiliarias tales como ventas, cambios de titularidad dentro de una familia o la construcción de otros pisos que luego se subdividen en apartamentos. Como resultado de ello, las propiedades vuelven a estar dentro de la categoría de informalidad y el registro público no refleja adecuadamente a los verdaderos propietarios.
Este problema representa un creciente motivo de preocupación para los expertos en políticas, quienes opinan que esta situación podría dar como resultado grandes costos sociales, económicos y legales. Sin un registro legal, pueden surgir rápidamente controversias entre hermanos acerca de la propiedad de un hogar familiar después del fallecimiento de sus padres. Resolver estas controversias puede implicar altos costos legales en los tribunales de Perú, que ya están sobrecargados y funcionan con lentitud. Los propietarios informales no pueden utilizar su propiedad como garantía para solicitar un crédito bancario formal y, si deciden poner la propiedad en el mercado, deben enfrentar un valor de reventa mucho más bajo. Además, existe el riesgo de debilitar la sostenibilidad del programa de títulos de propiedad pionero en Perú, una herramienta popular diseñada para promover el desarrollo económico que más tarde fue emulada en todo el mundo.
Tal como indica Julio Calderón, sociólogo peruano, investigador del Instituto Lincoln y experto en derechos de propiedad: “Los hijos están viviendo ahora la misma situación que vivieron sus padres hace 40 años: nuevamente están en una situación de informalidad. En términos urbanísticos, esto es una bomba de tiempo”.
El surgimiento de los asentamientos informales en Perú
De manera similar a otras capitales latino-americanas, Lima experimentó una explosión demográfica durante la segunda mitad del siglo pasado, a medida que las personas migraban desde todos los puntos del país a esta árida ciudad costera en busca de una vida mejor.
En 1950, en Lima vivían menos de un millón de personas. Para el año 2000, la cantidad de población se había inflado a 7,4 millones, según los datos de la División de Población de las Naciones Unidas. Hoy en día, la capital peruana alberga a más de 9 millones de personas, lo que representa casi un tercio de la población total del país. Los motivos por los que se da esta migración interna en Perú son variados, aunque la causa principal son las dificultades políticas y económicas que experimenta el campo. En la década de 1970, la economía rural se vino a pique después de una fallida reforma agraria llevada a cabo por el general Juan Velasco, un dictador militar de izquierda.
La economía se vio sacudida nuevamente a principios de la década de 1980 durante una de las peores tragedias climatológicas que se hayan registrado ocasionadas por El Niño, que causó terribles inundaciones y un colapso de la industria pesquera. Aproximadamente por esa misma época, los rebeldes de izquierda de Sendero Luminoso iniciaron una violenta insurgencia en las zonas montañosas del sur, lo que forzó a muchos residentes a huir hacia Lima para escapar del sangriento conflicto que dejaría un saldo de cerca de 70.000 vidas.
En Lima, el gobierno no estaba preparado para esta ola migratoria. Los nuevos residentes, sin tener un lugar donde vivir, comenzaron a apropiarse de terrenos vacantes en las afueras de la ciudad, en ocasiones enfrentándose a la policía. Uno de esos desarrollos informales se convirtió luego en San Juan de Lurigancho. Héctor Nicho, un líder comunitario del lugar, recuerda la impotencia de las autoridades ante la marea de personas que ocupaban las tierras con la esperanza de hacerlas suyas.
Nicho, que era sólo un niño cuando participó en la invasión de los terrenos hace unas cuatro décadas, lo relata de esta manera: “El primer día de la invasión hubo 15 ó 20 personas. Al día siguiente, hubo 500. Y al tercer día, 1.500. Éramos cada vez más. No podían detenernos, aun cuando el Estado había enviado a la policía”.
La ocupación de terrenos se produjo en toda la ciudad de Lima, resultando en la creación de distritos como Villa El Salvador (al sur de la ciudad) y San Martín de Porres (al norte). Los ocupantes ilegales eran algunos de los residentes más pobres de la ciudad, que vivían en áreas caracterizadas por la falta de presencia estatal y por una amplia economía informal.
Hacia finales de la década de 1980, la situación no hacía más que empeorar. La economía peruana entró en espiral hasta la hiperinflación. Sendero Luminoso, que había estado confinado a las zonas montañosas rurales, comenzó a invadir Lima rápidamente, amenazando con derrocar al gobierno e instalar un régimen de tipo maoísta.
El programa de títulos de propiedad de de Soto
Por ese entonces, Hernando de Soto, economista peruano, propuso una manera de salir del caos. De Soto sostenía que otorgar títulos legales de propiedad dispararía el desarrollo, ya que permitiría a los pobres obtener ventajas con sus bienes individuales en la economía formal y acceder al crédito. Sin embargo, según de Soto, existían barreras burocráticas complejas y costosas que impedían que esto ocurriera.
“Se dieron cuenta de que uno de los principales obstáculos a la hora de registrar las propiedades en Perú era su propio registro de la propiedad”, explica Ángel Ayala, abogado y experto en registro de la propiedad. “El problema no era la informalidad, sino que el sector formal no te dejaba acceder a él”, añade en referencia a las normas del gobierno para el registro de la propiedad que en ese momento eran complejas y costosas.
Perú abrazó las ideas de de Soto, lo que generó un nuevo marco legal con el fin de brindar títulos de propiedad a personas como los Reátegui, que vivían en asentamientos informales en lugares como San Juan de Lurigancho.
En 1996, el gobierno creó la Comisión de Formalización de la Propiedad Informal (COFOPRI), que dirigiría un programa nacional de otorgamiento de títulos de propiedad urbanos. Además se creó un registro paralelo, el Registro Predial Urbano. Este registro, que se concentró solamente en los asentamientos informales de Lima, recortó los requisitos para el registro de las propiedades, lo que permitió a los propietarios pobres de terrenos obtener títulos en forma rápida y a bajo costo.
Los resultados fueron impresionantes. Según un informe del Instituto Lincoln denominado Regularización de asentamientos informales en América Latina, cuyo autor es el abogado brasileño Edésio Fernandes, el COFOPRI redujo los tiempos necesarios para obtener el título de 7 años a 45 días, disminuyó la cantidad de trámites de 2.007 a 4, y bajó los costos de registro de US$2.156 a una suma casi nula.
Desde su creación, el COFOPRI ha emitido cerca de dos millones de títulos de propiedad, lo que lo convierte en uno de los mayores programas de este tipo en el mundo.
Tal como señala Jorge Ortiz, exempleado de COFOPRI y más tarde director de la SUNARP (el registro tradicional de Perú): “Los empleados del organismo trabajaban 24 horas al día. Verdaderamente se identificaron con lo que estaban haciendo”.
La política sobre títulos de propiedad de de Soto se convirtió en la manera preeminente de abordar el tema de la regularización del suelo en todo el mundo. Recibió elogios de varias organizaciones dedicadas al desarrollo, como el Banco Mundial y el Banco Interamericano de Desarrollo, y de políticos como el expresidente de los Estados Unidos, Bill Clinton. Perú, como país pionero en este programa, se convirtió en un modelo para otros países de América Latina, África y Asia que también estaban luchando contra la informalidad y la pobreza generalizadas.
Casi 20 años después de la creación del COFOPRI, los académicos han identificado varios beneficios sociales y económicos derivados del otorgamiento de títulos de propiedad. Por ejemplo, según muestran los estudios realizados, las familias que tienen un título formal invierten más en sus casas y en la educación de sus hijos. También tienen menos hijos.
Sin embargo, los críticos del programa sostienen que la hipótesis principal de de Soto –que los títulos de propiedad aumentarán el acceso de los pobres al crédito formal– simplemente no se hizo realidad como de Soto imaginó.
Estos críticos también señalan ciertas consecuencias no deseadas que son el resultado de los grandes programas de otorgamiento de títulos de propiedad, tales como la manipulación política y el incentivo que tienen los ocupantes ilegales para seguir invadiendo terrenos y creando nuevos asentamientos informales sin servicios, con la esperanza de que algún día puedan registrar sus propiedades.
Los riesgos de la desregularización
En Perú, uno de los mayores motivos de preocupación es la sostenibilidad de los títulos de propiedad, ya que una cantidad cada vez mayor de propiedades está cayendo en la desregularización. Muchos años después de haber ocupado los terrenos, los propietarios originales están jubilándose o falleciendo. Sus propiedades, que, por lo general, pasan a sus hijos, están volviendo a caer en la informalidad.
Según Fernandes, “Lo que hemos observado es que, a partir de la segunda o tercera operación inmobiliaria, las transacciones ya no se registran. Por diferentes motivos, la gente sencillamente deja de mantener sus propiedades en una condición por completo legal. Por lo tanto, en unos pocos años, volveremos al punto cero en términos de legalidad en el área”.
A menos que se produzca un cambio en las tendencias, los expertos en políticas dicen que el enérgico programa de otorgamiento de títulos de propiedad del gobierno podría desbaratarse, junto con sus beneficios.
Los propietarios informales corren el riesgo de perder el beneficio más básico derivado del título de propiedad: la seguridad de la tenencia y la protección legal contra el desalojo y el fraude. Y también podrían enfrentar otros costos, como gastos legales para resolver diferencias sobre la propiedad.
También existen costos de oportunidad. Los propietarios informales no pueden usar su propiedad para acceder al crédito formal, y además no recibirían una compensación al valor justo de mercado si decidieran vender sus casas.
Los alcances de la desregularización son difíciles de medir. No obstante, según un estudio reciente del Instituto Lincoln llevado a cabo por Oswaldo Molina, economista egresado de Oxford, sólo se ha registrado formalmente un 21 por ciento de las segundas operaciones inmobiliarias sobre propiedades en áreas que hace poco recibieron títulos de propiedad en Perú (Molina 2014).
Según Molina, “cuando comenzó la reforma, no se trataba sólo de una cuestión de otorgar títulos de propiedad a las personas sino de que mantuvieran la formalidad de sus propiedades. Entonces, ¿qué pasó con el 79 por ciento restante? Ahora vamos a tener muchísimas propiedades con títulos, pero a nombre de otras personas”.
Motivos para no registrar las transacciones
Ortiz comenta que, durante su gestión como director de la SUNARP, era muy raro que las personas registraran las segundas transacciones de sus propiedades. Para él, esto ha sido una desilusión.
“Yo creía en el modelo de la década de 1990”, dice Ortiz, que fue director de la SUNARP durante los comienzos del gobierno del presidente Ollanta Humala en 2011. “Ahora, unos 30 años después, veo que puede echarse todo a perder”.
Las causas de la desregularización no son muy claras, aunque los expertos apuntan a problemas culturales y cambios en las políticas públicas como algunos de los motivos más importantes.
En muchos lugares de Perú, existe un gran respeto por las decisiones que los padres transmiten en forma verbal, aun en relación con importantes cuestiones de tipo legal, como el registro de propiedad. En aquellos casos en que el hogar familiar se subdivide, los hijos dependen de sus padres –los propietarios– para firmar la transacción y así poder obtener un título formal.
Según los expertos, muchos padres no tienen problemas de que sus hijos paguen por la subdivisión, pero no consideran la posibilidad de otorgar un título formal, ya que creen que un acuerdo verbal es suficiente para dividir la propiedad. En otros casos, los padres se niegan a otorgar un título por temor a perder el control de sus casas.
“Todavía existe la cultura de respetar la decisión y la palabra de los padres”, dice Jesús Quispe, director de CENCA, un instituto de desarrollo urbano con sede en Lima que trabaja en San Juan Lurigancho. “Muy pocas operaciones quedan plasmadas en el sistema legal. Existe una cultura de la informalidad”.
Ramiro García, director del programa urbano de DESCO, una organización de desarrollo peruana, explica que muchas familias hacen caso omiso del registro público hasta que surge algún problema, como por ejemplo una controversia legal sobre la propiedad del inmueble.
“Es un trámite burocrático, costoso y las familias no lo consideran necesario”, señala García desde su oficina en Villa El Salvador.
Con anterioridad a la explosión demográfica en Lima, las familias que no podían acceder a comprar una casa podían mudarse a las afueras de la ciudad, ocupar un terreno y construir una casa. Hoy en día, ya no existen muchos lotes vacantes. Los que quedan se encuentran al borde de las montañas, terrenos que suelen ser inestables para vivir.
A medida que la disponibilidad de terrenos es cada vez más escasa, la demanda de viviendas se ha mantenido sólida. En consecuencia, la ciudad ha comenzado a expandirse hacia arriba y los edificios de apartamentos están reemplazando a las casas.
Los precios inmobiliarios también se han disparado debido al fuerte crecimiento económico que Perú experimentó durante los últimos diez años. Para las familias jóvenes de clase media-baja, los precios cada vez más altos les hacen cada vez más difícil acceder a una casa propia.
A fin de ayudar a sus hijos, los padres que se asentaron en las afueras de Lima hace unas décadas ahora están agregando dos o tres pisos a sus casas para subdividirlos luego en apartamentos.
En San Juan de Lurigancho, Melly Rosas, una mujer de 53 años que trabaja de secretaria en una iglesia, decidió agregar tres pisos más a su casa cuando vio cómo les costaba a sus hijos casados ahorrar el dinero necesario para comprar una propiedad.
“Al principio, este no era nuestro plan”, dice Rosas, “pero era muy costoso para mis hijos comprar un terreno mientras pagaban un alquiler”.
“Estamos construyendo hacia arriba porque ya no hay más espacio”, agrega Rosas, en referencia a la creciente cantidad de edificios que han aparecido en su barrio.
Rosas y su esposo, Ricardo, no han averiguado cómo otorgarles los títulos de propiedad de los apartamentos a sus hijos, aunque ya lo están evaluando. Según Rosas, “sabemos que tenemos que hacerlo, porque así ellos tendrán menos problemas. Pero por ahora, todo es un acuerdo verbal”.
A una corta distancia en automóvil, en una tranquila calle residencial, Marcelo Núñez, un zapatero de 52 años, vive en una casa espaciosa con techos altos que ayudan a mantenerla fresca en los calurosos veranos de Lima. Anexo a la casa hay un pequeño negocio, donde su esposa vende refrescos y patatas fritas.
Al igual que hicieron sus vecinos, Núñez y su familia construyeron lentamente su casa durante los últimos 30 años, una pared cada vez. Ahora su hija de 28 años está construyendo un segundo piso, adonde irá a vivir con su bebé. El hijo de Núñez, de 25 años, probablemente vivirá en el tercer piso.
Núñez dice que no tiene intenciones de registrar los pisos superiores de su casa, aunque serán propiedad de sus hijos. “Por mi parte, no he pensado hacerlo legalmente, porque somos una familia”, dice Núñez. “Es bastante extraño hacer una subdivisión legal. Por lo general, esto se hace verbalmente”.
No obstante, Núñez coincide con Rosas en que dejar a sus hijos una propiedad sin título formal podría generarles problemas en el futuro. “Si ellos están de acuerdo, yo no tendría problemas en hacerlo legalmente”, dice Núñez.
Sin embargo, los factores culturales no son el único impedimento para registrar las propiedades. Los expertos en políticas señalan que las personas como Rosas y Núñez deberán cumplir varios requisitos regulatorios muy costosos si deciden en algún momento formalizar sus propiedades.
Según los expertos, los obstáculos surgieron debido a la decisión del gobierno de eliminar el Registro Predial Urbano, el registro paralelo creado al fin de acelerar el registro formal de las propiedades en los asentamientos informales de Lima.
En 2004, Perú fusionó el Registro Predial Urbano con la SUNARP, el registro público tradicional, considerado demasiado costoso y burocrático. Los trámites más simples que tenía el Registro Predial Urbano para registrar las segundas y terceras transacciones sobre un inmueble fueron reemplazados por los requisitos más complicados y costosos de la SUNARP.
Los críticos de esta decisión señalan que el gobierno realizó este cambio debido a la presión ejercida por grupos de poder que representaban a los notarios públicos, quienes estaban preocupados ante la posibilidad de perder un lucrativo negocio a causa del Registro Predial Urbano. A diferencia del registro tradicional, el Registro Predial Urbano permitía a los propietarios contratar a cualquier abogado, y no solamente a notarios, para legalizar sus transacciones.
Según Ayala, abogado especializado en títulos de propiedad, “al regresar al antiguo sistema, los costos se quintuplicaron. La gente se negó a hacerlo. El problema no es cultural. Se trata de encontrar la forma de mantener el proceso de obtención de títulos dentro del sistema formal”.
La desregularización en Perú tiene consecuencias de gran alcance para otros países que establecieron sus propios programas de títulos de propiedad siguiendo el modelo peruano.
Sebastián Galiani, de la Universidad de Maryland, y Ernesto Schargrodsky, de la Universidad Torcuato Di Tella (ambos economistas argentinos e investigadores del Instituto Lincoln) observaron que en un suburbio de Buenos Aires donde recientemente se habían otorgado títulos de propiedad, una parte importante de las propiedades estaba cayendo nuevamente en la informalidad. En un estudio de 2013, los autores concluyeron que la desregularización probablemente se debía a que el costo para mantener la formalidad de las propiedades era inaccesible para las personas (Galiani y Schargrodsky 2013).
“Este no es sólo un problema peruano”, dice Molina, el economista que estudió la desregularización en Perú, “sino algo mucho más amplio que se da en toda la región. Es un problema de visión a corto plazo de la reforma”.
Posibles soluciones
Para frenar el aluvión de la desregularización, los expertos en políticas señalan que los gobiernos deben intervenir inmediatamente para impedir que en el futuro se generen programas costosos de otorgamiento de títulos.
Ya se han tomado algunas pequeñas medidas. En 2007, el gobierno promulgó leyes para otorgar fondos a propietarios de bajos recursos con el fin de formalizar las subdivisiones de sus propiedades, un proceso que requiere, en primer lugar, registrar la construcción de la vivienda (el programa de registro en Perú otorgaba a los residentes el título de propiedad del terreno, no de la vivienda que se construía sobre el mismo). Sin embargo, los expertos en registros dicen que el programa de 2007 nunca se implementó de manera completa.
Lo que es más importante, los expertos dicen que el gobierno debería restablecer los trámites simples, como aquellos que se eliminaron cuando el Registro Predial Urbano se fusionó con la SUNARP. Según Molina, “algo concreto que puede hacerse es reconsiderar los mecanismos que se utilizaron anteriormente. El Registro Predial Urbano se creó con el fin de que los pobres pudieran obtener los títulos de propiedad de manera correcta”.
Pero tal vez no sea suficiente hacer cambios sólo en las regulaciones. Muchos expertos insisten en el hecho de que el problema requiere que las autoridades aborden también el tema más amplio de la cultura de la informalidad en Perú. Para ello, según los especialistas, el gobierno debería lanzar una campaña con la finalidad de educar a los residentes sobre la importancia de mantener la formalidad de sus propiedades.
“Este es un problema que debe tratar el gobierno”, dice Gustavo Riofrío, sociólogo e investigador del Instituto Lincoln, quien ha dedicado su carrera a estudiar los derechos de propiedad. “Tenemos una ciudad entera que ha sido construida por personas que enfrentan el mismo problema. Ya no se trata de un problema individual, sino social”.
Los funcionarios de la SUNARP dicen que están trabajando para simplificar los trámites relacionados con las operaciones inmobiliarias sin poner en riesgo la seguridad legal que brinda el sistema actual. Señalan, además, que están trabajando para educar a las personas en a la importancia de utilizar el registro, aunque reconocen que el gobierno “no ha logrado inculcar en la población la importancia de la formalización”.
Hasta que exista una mayor aceptación del sistema regulatorio, algunos abogados opinan que Perú debería establecer la obligatoriedad del registro. A diferencia de muchos otros países, Perú no requiere el registro de las operaciones inmobiliarias, sino que es voluntario.
Como asegura Ortiz: “Debemos educar a las personas para que comprendan que el registro no sólo les brinda seguridad sino que también genera valor. Pero hasta que tengamos una nueva cultura, será necesario modificar el Código Civil para requerir a las personas que registren sus propiedades”.
En el hogar de Amalia y Eusebio, en San Juan de Lurigancho, su hija de 40 años, Emma, está ansiosa por hablar acerca de los títulos de propiedad.
Emma, que vive con su hijo en un apartamento del tercer piso, dice que la subdivisión de la vivienda familiar hasta ahora ha funcionado bastante bien. Los diferentes miembros de la familia respetan el espacio de cada uno, pero siguen reuniéndose los domingos para almorzar. Los hijos también ayudan a sus ancianos padres con algunos gastos, como los alimentos.
No obstante, Emma sabe que es muy importante definir legalmente la titularidad de la propiedad, en particular después de haber visto a otras familias quedar atrapadas en conflictos legales relacionados con sus propiedades. Emma cree que sus padres, a la larga, comenzarán el trámite para otorgar los títulos de propiedad a sus hijos.
“Mi madre y mi padre todavía se sienten bien físicamente. Cuando esto cambie, creo que lo dejarán ir”, dice Emma. “Pero por el momento, todavía lo mantienen todo junto. Para mí, está bien”.
Ryan Dubé es un periodista canadiense que vive en Lima, Perú. Sus artículos han sido publicados en The Wall Street Journal, The Globe & Mail y Latin Trade. También ha trabajado en proyectos para la Unidad de Inteligencia de The Economist.
Referencias
Fernandes, Edésio. 2011. Regularización de asentamientos informales en América Latina. Cambridge, MA: Lincoln Institute of Land Policy. www.lincolninst.edu/pubs/dl/1962_1283_Regularization%20PFR%20Span%20Rev%202012.pdf
Galiani, Sebastián y Ernesto Schargrodsky. 2013. “Land De-Regularization”. Documento de trabajo. www.utdt.edu/ver_contenido.php?id_contenido=2674&id_item_menu=4526
Molina, Oswaldo. 2014. “Loss of Plot Formality through Unregistered Transactions: Evidence from a Natural Experiment in Peru”. Documento de trabajo. Cambridge, MA: Lincoln Institute of Land Policy. www.lincolninst.edu/pubs/2447_Loss-of-plot-formality-through-unregistered-transactions